
Regulation series
The history of financial rules in football, Part 3: the new system, SCR and SSR from 2026/27
Part 3 of the Orange Ledger's series on football's financial rules. From 2026/27 the Premier League has split the two questions PSR tried to answer with one number. The Squad Cost Ratio asks whether a club's squad is affordable against its revenue; the Sustainability and Systemic Resilience rules ask whether the club can survive a shock. This is how both work, what they count, and what they still cannot see.
Figures as of 31 October 2026, Orange Engine release V2CI · Latest figures · What the engine does not capture
Latest change to the figures, 31 October 2026: Chelsea’s ratio is 92.3%, from 88.6%, because of a double count and a filed sale profit. Latest correction, 3 November 2026: descriptions of the rules, with no figure changed. All 15 correction notes are at the end.
Part 2 ended with the central weakness of PSR: it tried to answer two different questions with one number. Is the squad affordable? And is the club financially healthy? From the 2026/27 season, the Premier League answers them separately.
- The Squad Cost Ratio (SCR) looks only at the cost of the squad, measured against the club’s football revenue plus its averaged net profit or loss on player sales.
- The Sustainability and Systemic Resilience (SSR) rules look at the club as a whole: its cash, its ability to survive a bad season, and its balance sheet.
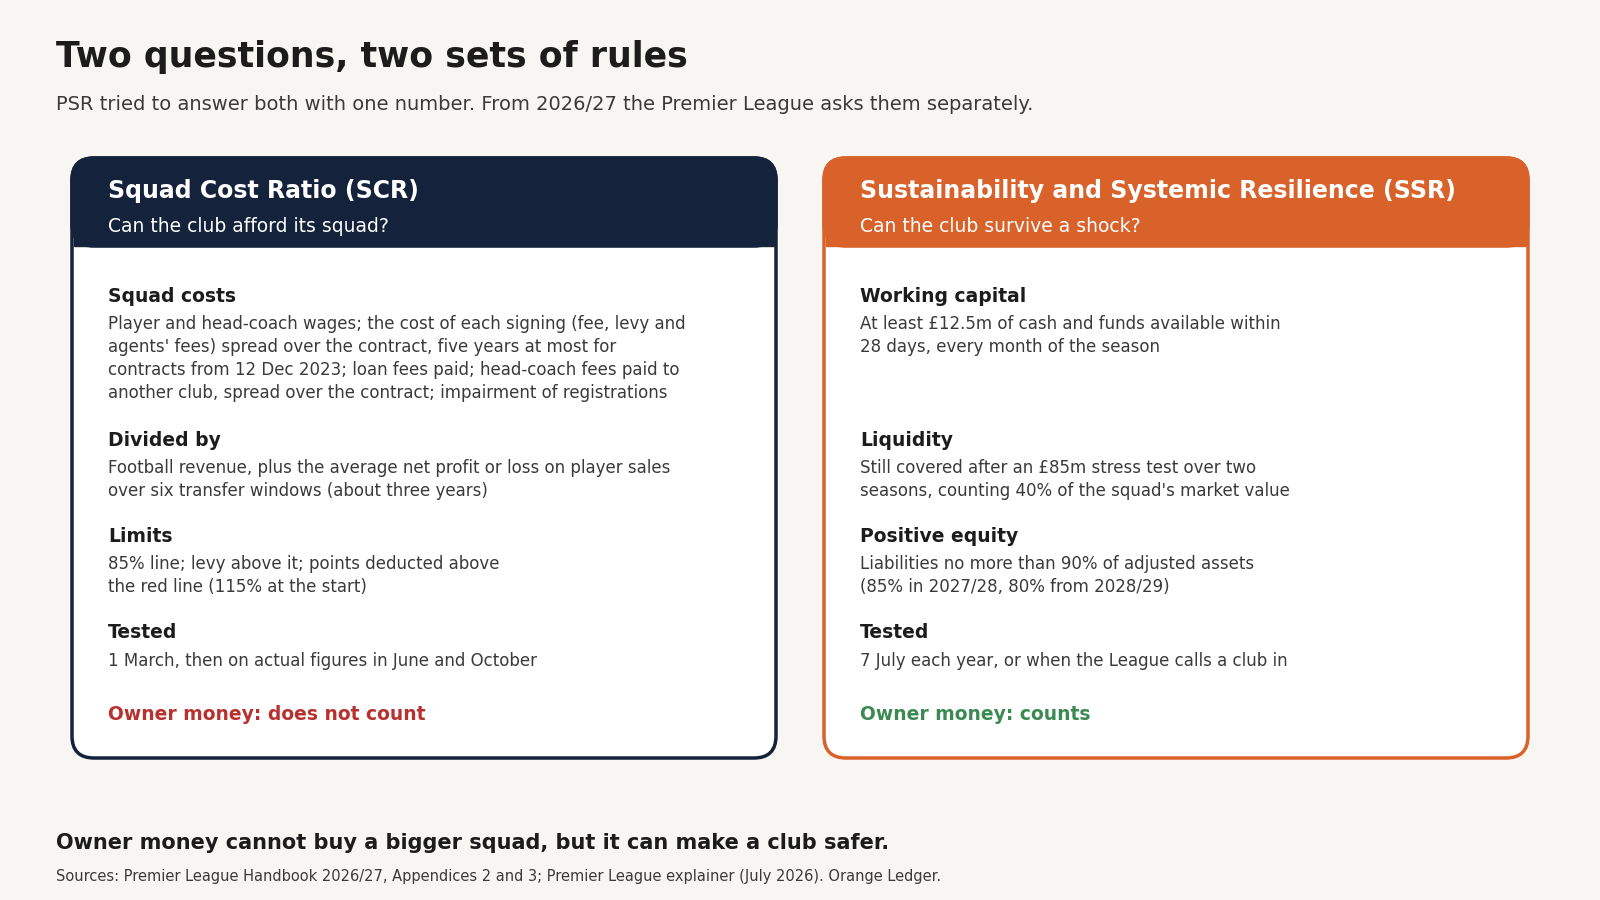
The clubs voted the new system in on 21 November 2025. The squad cost ratio passed by 14 votes to six, the minimum two-thirds majority. The resilience rules passed unanimously. The squad cost ratio had been run in trials, without sanctions, since the middle of 2024/25.
The squad cost ratio: what it counts
The ratio is one figure divided by another.
On top, squad costs. The main costs are:
- Wages of players and the head coach.
- The cost of each signing, spread over the player’s contract. The rule counts the fee, the League’s 4% transfer levy and agents’ fees paid on the deal. A player signed for £60m on a five-year contract counts as at least £12m a year, the accounting charge known as amortisation. For contracts signed or extended on or after 12 December 2023, the spreading is capped at five years; older contracts run their full term.
- Agents’ fees charged in the year.
The cost also includes fees paid to borrow players, the fee paid to another club for a head coach, spread over his contract, and any write-down of a registration’s value. Fees received for lending players out first offset that player’s wages, transfer cost and agents’ fees; any surplus counts with the profit on player sales.
Underneath, revenue. The club’s football income from broadcasting, matchdays and commercial deals, plus the average profit on player sales over the last six transfer windows, about three years.
That averaging is one of the most important choices in the system. Player trading still matters, but differently from PSR. One exceptional sale still adds room, but only a third of its profit counts in any one test, and it keeps counting for as long as the sale stays within the six windows. A club that sells well every year, however, builds a permanently larger spending base. The rule rewards a club that is consistently good at developing and selling players, not one that makes a single big sale to fix a single year.
Some things are left out on purpose:
- Owner money. New shares bought by an owner, or a loan from one, do not appear on either side of the ratio. They can pay the bills, but they do not create room to spend on players. This is the biggest change from PSR, where owner equity could unlock a larger loss allowance.
- Spending outside the squad. Stadiums, training grounds, the academy, women’s football and community work are not squad costs, so owners can invest in them without using up any of the club’s allowance.
- Inflated income. Deals with companies linked to a club’s owner count only at their fair market value, under the rules described in Part 2.
The thresholds
The ratio is tested against a line and a band.
- 85% is the line. A club complies when its squad costs are no more than 85% of its football revenue plus its averaged net result on player sales, taken together.
- Above 85%, a club may face a levy, from 2027/28 onwards, if its confirmed results remain above the line. The levy is the overspend, taken as the lower of the March test’s figure and the figure on actual results, multiplied by the number of percentage points the club is over on actual results. A club with a £500m base of revenue and averaged sale result, at 90% on both tests, is £25m over the line and 5 percentage points over it, so it pays 5% of £25m: £1.25m, before any relief. The levy money is shared equally among the clubs that complied.
- A good record can reduce the levy. A club that stayed under 85% in each of the two previous seasons can use the margin it built up, to a maximum of 10 percentage points, to reduce or remove the levy. The relief can be used only once every three seasons, and it does not change the club’s allowance or its red line.
- Every club starts with an allowance of 30 percentage points above 85%, so the line at which league points are deducted begins at 115%.
- Above that red line, a club loses league points: six, plus one more for every £6.5m, or part of it, above the line. A second breach in consecutive seasons multiplies the deduction by 1.3.
- The allowance moves. A breach reduces the allowance for the next season by the size of the breach: a club at 100% has 15 percentage points left the following season, so its red line falls to 100%. Each season at or below 85% restores 10 percentage points, up to the full 30.
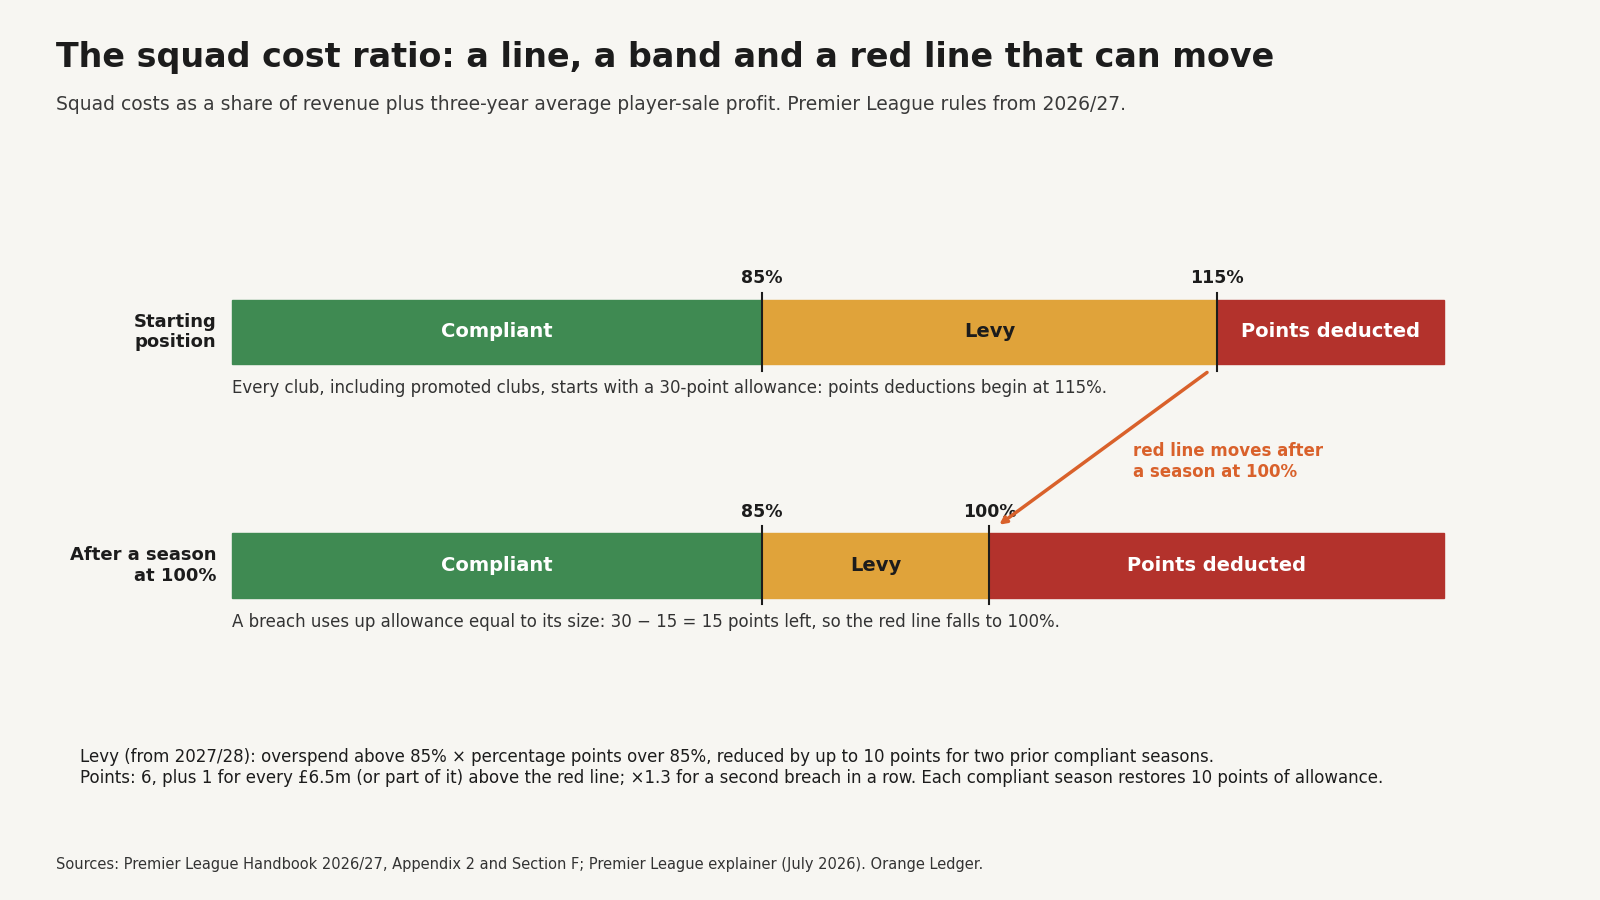
The ratio is tested once a season, on 1 March, after the January transfer window, using revenue figures agreed with the League before the season starts. A club above 85% is then tested again on its actual figures in June and in October. That makes the rule far quicker than PSR, where a breach could take years to establish.
Why 85%, when UEFA uses 70%? The League’s own explanation is that the extra room lets clubs that do not regularly play in Europe compete for a European place against clubs that already earn European money, and lets a club that misses out on Europe adjust over several seasons rather than cut costs overnight.
How revenue is counted
Because revenue sets the limit, the rules are precise about which revenue counts, and several parts of it are cushioned against one bad season. The cushions are deliberate: they are meant to stop one poor season from collapsing a club’s spending limit and forcing it to sell players just to stay compliant.
- Prize money for league position counts at the best of three figures: last season’s position, the average of the last three seasons, or 15th place.
- Commercial income counts at last season’s figure, with merchandise at gross profit (sales less the cost of the goods).
- European prize money counts only if the club has qualified for European competition in the season being tested and goes past its qualifying stage. A club that has not gets nothing: there is no floor.
- Promoted clubs are treated as if they finished 15th, and their commercial income counts at the best of last season, their three-season average or £15m.
A promoted club also starts with the full 30-point allowance, and can ask for relief from the levy if it complied with the rules that applied to it in the two previous seasons.
Clubs playing in Europe face a second limit. UEFA’s own squad cost rule has capped them at 70% since 2025/26, and they must meet both.
What our estimates showed in October 2026
The Orange Ledger has rebuilt the ratio for all 20 Premier League clubs from their filed accounts and transfer records, for the first test in March 2027. Three clubs are clearly above the 85% line on those estimates: Fulham (102.7%), Nottingham Forest (97.4%) and Ipswich Town (97.9%). Chelsea’s central estimate is 92.3%, in an assumption range (the spread between our lowest and highest reasonable assumptions, not a probability) of 82.9% to 96.8% that reaches below the line. Bournemouth’s central estimate is 85.4%, in an assumption range of 78.3% to 86.9% that spans the line: the estimate does not reliably tell which side of the line the club is on. None is near the 115% red line. These are the figures of our October release, kept here as published; the full table carries the current estimates, and the individual club reconstructions show how each figure was built.
The resilience rules: can the club survive a shock?
The squad cost ratio asks whether a club can afford its squad. The Sustainability and Systemic Resilience rules ask whether it can survive when things go wrong. They apply three tests, each looking further ahead.
1. Working capital: the next few months. For every month of the season, a club must show at least £12.5m of cash and money it can reach within 28 days, such as an unused credit facility. The test is meant to cover short-term shocks: a sponsor going bust, part of a stadium closing, or a transfer fee arriving late.
2. Liquidity: the next two seasons. A club must show that its liquid resources, including 40% of the market value of its players, would still cover its obligations after a stress test of £85m. The stress test represents events such as relegation, missing out on Europe or losing a major sponsor. The League can set a higher figure for a club whose exposure is larger.
3. Positive equity: the balance sheet. A club’s liabilities, divided by its adjusted assets, must not exceed 90% in 2026/27, 85% in 2027/28 and 80% from 2028/29. Every liability counts, including loans from the owner and external debt, while the squad is included in the club’s assets at its full market value, or its value in the accounts if that is higher. In plain terms, a club must own more than it owes, with a margin that grows over three seasons. This is the test designed to stop clubs carrying unreasonably high debt.
The tests are assessed each year on 7 July, when clubs also submit their forecasts for the next two seasons, and the League can call a club in for a fresh assessment at any point in the season. Newly promoted clubs take the liquidity and equity tests on 31 October. Failing a test brings no automatic points deduction, unlike the squad cost ratio. The club must submit a business plan showing how it will return to compliance; if the League is not satisfied it can impose measures such as a spending limit or a requirement for approval before new contracts are registered, and a club that does not comply with those measures can face disciplinary proceedings.
What the three tests share is that none of them asks whether a club is profitable. They ask whether it has enough cash to hand, enough to absorb a shock and enough assets behind its debts to keep functioning if something goes wrong. A club can lose money and still pass, if its owners provide the capital and its balance sheet stays strong.
Here, owner money does count. An owner who buys new shares brings in cash and strengthens the balance sheet; one who turns existing loans into shares brings in no cash, but reduces what the club owes. Either can help it pass. That is the split in one sentence: owner money cannot buy a bigger squad, but it can make a club safer.
What the new system still cannot see
The new system fixes several of PSR’s weaknesses: it is faster, it grows with each club’s revenue, and it no longer lets a hotel sale pay for a striker. But four questions remain open, and most have been the subject of an Orange Ledger reconstruction.
- The squad cost ratio cannot see debt. Interest, loan repayments and dividends are not squad costs. Manchester United sit comfortably inside the line at 56.9%, while running cash shortfalls of £89m, £201m and £50m in the last three seasons. The resilience rules can see debt, but they ask whether a club can withstand it, not whether servicing it is a good use of the club’s money.
- The ratio works with a delay. Because revenue is cushioned and averaged, a bad season, or a sanction, reaches the ratio a year or more later, and then stays in it for several seasons. The Orange Ledger’s scenarios for Manchester City show how a single points deduction would echo through the rule until 2030.
- The ratio rewards revenue that already exists. A club’s limit is a share of its own income, so a club earning £700m can spend far more than a club earning £150m, and owner money cannot close the gap. The Orange Ledger’s comparison of Chelsea and Manchester City shows how much that matters.
- Compliance at 85% is not financial health. The 85% line is not a profit target. Because profit on player sales is included in the calculation, a club at 85% can spend more than 85% of its football revenue on its squad. The ratio says nothing about whether the club can also cover its other staff, running costs, interest, tax and investment. A club can comply and still lose money or run short of cash.
There is also the level itself. At 85%, a club can spend most of any new revenue on its squad. UEFA’s report on the European club game in September 2026 found that Premier League clubs spent an estimated €4.6bn on transfers in summer 2026, equal to 56% of their annual revenue, against an average of 33% in the decade before Covid. Whether 85% is the right level is a question for Part 5.
What Part 3 shows
- The new system asks two questions instead of one. The squad cost ratio tests the squad; the resilience rules test the club.
- Owner money has changed role. It no longer buys spending room, but it still counts towards a club’s safety.
- The limit grows with revenue. That makes the rule fairer between large and small clubs in one sense, and harder on small clubs trying to catch up in another.
The last point is where the argument over the rules now sits. When the clubs voted for the squad cost ratio, they also voted on a proposal designed to deal with it: a cap linking the biggest clubs’ spending to the smallest club’s income. It was rejected. Part 4 explains what it was, and why it failed.
Next in the seriesPart 4: the anchor that was voted down
Sources and caveats.
The rules. Premier League Handbook 2026/27, Appendix 2 (squad cost definitions, the levy, the allowance and the feedback loops) and Section F (sporting sanctions); the Premier League's explainer on the new financial system (21 July 2026), including the levy offset mechanism, the test dates, the Accounts Confirmation Tests and the League's reasons for the 85% threshold; and its statement of 21 November 2025.
The resilience rules. The Premier League's explainer (July 2026) for the three tests, the £12.5m working capital threshold, the £85m stress test, the 40% of squad market value in the liquidity test, the treatment of shareholder loans and external debt in the equity test, the 7 July and 31 October assessment dates, Call-In Events and the measures available to the League; Farrer & Co and Brabners on the equity ratio thresholds. Premier League Handbook 2026/27, Appendix 3 (the SSR Rules), for the business plan, the measures the Board may impose and the disciplinary route for a club that does not comply with them.
The vote. The Premier League's statement of 21 November 2025 for the vote; the 14-6 count on the squad cost ratio as reported by AFP (Vanguard, 21 November 2025), and the unanimous vote on the resilience rules as reported by SportsPro (21 November 2025); the Premier League as reported by PA on the trials in 2024/25 and 2025/26.
UEFA. UEFA's Financial Sustainability Regulations (70% squad cost limit from 2025/26). UEFA's European club talent and competition landscape report (September 2026) as reported by Inside World Football.
Orange Ledger figures. Squad cost ratios are the Orange Ledger's independent estimates for the 1 March 2027 test, published in the SCR table and individual club reconstructions. They are not official.
The full source register for this series is held with the Orange Engine.
Corrections and updates (15)
3 October 2026 · Data correction · several figures: see the note
Update, 3 October 2026. Nottingham Forest’s ratio is now 97.0%, from 96.7%, Chelsea’s is now 88.0%, from 88.6%, and Manchester United’s is now 58.1%, from 58.7%, after home matches were counted from match reports and last season’s matchday receipts were re-estimated (How we estimate matchday revenue). A separate review of agents’ fees on signings since the last accounts is under way and may raise this figure; we will report its result.
4 October 2026 · Methodology change · several figures: see the note
Update, 4 October 2026. Fulham’s ratio is now 106.0%, from 102.6%, Nottingham Forest’s is now 102.5%, from 97.0%, Ipswich Town’s is now 94.1%, from 88.8%, Chelsea’s is now 94.0%, from 88.0%, Bournemouth’s is now 85.2%, from 81.7%, and Manchester United’s is now 58.8%, from 58.1%, after registrations were counted at the reported fee plus 12% and merchandise at gross profit, and cup prize money was rebuilt from each club’s cup ties (Three definitions in the squad cost rule, and what they change). Bournemouth’s central estimate is on the 85% line, with about a third of the modelled outcomes above it. The descriptions of what counts as squad cost and as commercial income now give the rule’s own definitions, and the diagram is redrawn to match.
5 October 2026 · Methodology change · several figures: see the note
Update, 5 October 2026. Fulham’s ratio is now 106.4%, from 106.0%, Nottingham Forest’s is now 103.4%, from 102.5%, Ipswich Town’s is now 95.8%, from 94.1%, Chelsea’s is now 94.3%, from 94.0%, and Manchester United’s is now 59.0%, from 58.8%, after contract lengths were measured from their dates and, at Ipswich, commercial revenue was taken from the group’s accounts (the engine changelog). Bournemouth’s central estimate is now 85.5%, from 85.2%, in a range of 80.1% to 87.7%, with about 38% of the modelled outcomes above the 85% line, from about 34%: the estimate does not reliably tell which side of the line the club is on.
5 October 2026 · Regulatory interpretation · several figures: see the note
Update, 5 October 2026. Manchester United’s ratio is now 57.3%, from 59.0%, after the estimate was built on the accounts of the group the rule describes, where it had been built on the club company’s (the engine changelog).
7 October 2026 · New evidence · several figures: see the note
Update, 7 October 2026. Fulham’s ratio is now 104.0%, from 106.4%, and Chelsea’s is now 93.2%, from 94.3%, after each club’s inputs were checked against its own announcements, the League’s squad lists and its filed accounts (the engine changelog). Bournemouth’s central estimate is unchanged at 85.5%, in a range of 80.1% to 87.7%, with about 37% of the modelled outcomes above the 85% line, from about 38%: the estimate does not reliably tell which side of the line the club is on.
9 October 2026 · Methodology change · several figures: see the note
Correction, 9 October 2026. Fulham’s ratio is now 102.7%, from 104.0%, Nottingham Forest’s is now 102.3%, from 103.4%, Ipswich Town’s is now 97.1%, from 95.8%, and Chelsea’s is now 92.5%, from 93.2%, after last season’s commercial revenue was estimated by one published method for every club, where each figure had been a judgement of ours (how we estimate last season’s commercial revenue); Ipswich Town’s estimate is provisional. Bournemouth’s central estimate is unchanged at 85.5%, in a range of 79.5% to 87.8%, from 80.1% to 87.7%, with about 35% of the modelled outcomes above the 85% line, from about 37%: the estimate does not reliably tell which side of the line the club is on.
15 October 2026 · Editorial · several figures: see the note
Clarification, 15 October 2026. Wording only; no figure changed. The ranges quoted in this article are assumption ranges, the spread of the model’s inputs between assumed bounds, not calibrated or confidence intervals, and the shares of modelled outcomes above the 85% line quoted in the notes above are withdrawn.
16 October 2026 · Assumption revision · several figures: see the note
Updated 16 October 2026: loans out now recorded; wage relief shown in ranges. Nottingham Forest’s ratio is now 99.3%, from 102.3%, and Manchester United’s 56.9%, from 57.3% (the engine changelog). Chelsea’s central estimate is unchanged at 92.5%, but its assumption range, 83.0% to 97.2%, now reaches below 85%, so this article no longer counts Chelsea among the clubs clearly above the line. Bournemouth’s range is now 79.0% to 87.6%.
23 October 2026 · Methodology change · several figures: see the note
Correction, 23 October 2026. Nottingham Forest’s ratio is 97.6%, from 99.3%, and Chelsea’s 89.1%, from 92.5%, in an assumption range of 80.2% to 93.5%, from 83.0% to 97.2%. Both rested on readings of the rule since corrected: the profit on player sales is averaged over the six most recent transfer windows (Rules A.1.13 and A.1.53), not three financial years, and the five-year cap applies to contracts already on the books (Rule A.1.22(c)). The article had kept its earlier figures when those corrections were made. Forest remains clearly above 85%, and the argument does not change. See the engine changelog.
24 October 2026 · Methodology change · no figure changed
Correction, 24 October 2026. No figure changed. This article said the rule averages profit on player sales over the last three years. It takes the profit or loss on sales in the six most recent transfer windows and divides it by three (Rules A.1.13 and A.1.53). Six windows cover about three years, but a club’s sales from February to the end of its financial year fall in a later window than the rest of that year, so they stay in the average for one test longer. The sentence now says six transfer windows. The figures in this article already count sales by window.
25 October 2026 · Regulatory interpretation · no figure changed
Correction, 25 October 2026. No figure changed. Four statements are corrected. The five-year cap was given as applying to every contract, as under PSR; it applies to contracts signed or extended on or after 12 December 2023, including those already on the books, and older contracts run their full term (Rule A.1.22(c)). The allowance was said to rebuild by 10 percentage points in each compliant season; it rebuilds in each season at or below 85%, the green line (Rules C.3 and A.1.44). European prize money was said to count with no cushion; it counts at the highest of three amounts for a club that qualifies and goes past the qualifying stage, and not at all for one that does not (Rule A.1.29(e)), which is what the sentence now says. And the trials ran from the middle of 2024/25, where the article said the two seasons before the vote.
26 October 2026 · Regulatory interpretation · several figures: see the note
Correction, 26 October 2026. Fees paid and received for head coaches now count, and filed loan income is in the ranges. A fee one club pays another for a head coach is part of the squad cost, spread over his contract (Rule A.1.22(d)); compensation a club receives for releasing one counts with the profit on player sales (Rule A.1.29(g)). We had counted neither. Fees received for lending players count with the profit on player sales (the guidance to Rule A.1.29(g)); the accounts do not split them from wages recharged, so they widen the range and leave the central figures alone. Ipswich’s ratio is 97.9%, from 97.1% (the fee for Gary O’Neil); Chelsea’s 88.3%, from 89.1%, in a range of 79.4% to 92.6%, from 80.2% to 93.5% (the compensation for Enzo Maresca); Bournemouth’s range is 78.4% to 87.0%, from 79.0% to 87.6% (filed loan income).
28 October 2026 · Data correction · several figures: see the note
Correction, 28 October 2026. We checked every transfer in our records against published sources and corrected sixteen entries at eleven clubs where the club’s announcement or a reputable report, read on the page, gives a different fee, contract length or date. Chelsea’s ratio is 88.6%, from 88.3%, in a range of 79.7% to 92.9%, from 79.4% to 92.6%; Bournemouth’s is 85.4%, from 85.5%, in a range of 78.3% to 86.9%, from 78.4% to 87.0%; Nottingham Forest’s is 97.4%, from 97.6%.
31 October 2026 · Data correction · SCR 88.6% → 92.3%
Correction, 31 October 2026. Chelsea’s ratio is 92.3%, from 88.6%. Bashir Humphreys and Kepa Arrizabalaga were counted twice, in 2024/25 by the accounts and in 2025/26 by us, and summer 2025 sale profit is now anchored to note 30 of the accounts of Chelsea FC Holdings: £31.8m, where we had modelled £82.4m. The assumption range is 82.9% to 96.8%, from 79.7% to 92.9%. Figures that follow from these are restated with them in the text. The correction does not reverse the article’s conclusion.
3 November 2026 · Regulatory interpretation · no figure changed
Correction, 3 November 2026. No figure changed. Several descriptions of the rules are corrected. The 15%: the article said a club at 85% has the remaining 15% of revenue for everything outside the squad. The ratio counts profit on player sales alongside revenue, so a club at 85% can be spending more than 85% of its football income on the squad. Squad costs: the article listed wages, signings and agents’ fees. The cost also includes loan fees paid, a head coach’s fee and any write-down of a registration (Rule A.1.22 and its guidance); the 26 October note had added the coach’s fee to the figures but not to this description. That note also said fees received for lending players count with the profit on player sales; they first offset the player’s wages, transfer cost and agents’ fees, and only the surplus counts (the guidance to Rule A.1.29(g)). The opening description and the 85% line now name the base the rule uses, football revenue plus the averaged net profit or loss on player sales, where they said revenue. One big sale: the article said one exceptional sale cannot create a large amount of room. It does add room, but only a third of its profit counts in any one test. The levy: the overspend is the lower of the March test’s figure and the one on actual results (Rule A.1.35), the levy applies only if a club’s confirmed results remain above 85%, and the example is now stated before any relief. The levy is shared equally among the clubs that complied (Rule E.5), which the article already said. The resilience rules: the article said a club that fails does not lose points. There is no automatic deduction, but a club that does not comply with the measures the League imposes can face disciplinary proceedings (Appendix 3, Section G). Owner money: the article said turning loans into equity improves a club’s cash. It reduces what the club owes but brings in no cash; new shares do both. The section on our estimates is now headed as of October 2026, the release whose figures it keeps, and points to the table for the current ones. The opening diagram is redrawn to match: the five-year limit on spreading a signing’s cost applies to contracts from 12 December 2023, the squad costs include loan fees, a head coach’s fee and impairment, and the base is the averaged net profit or loss on player sales over six transfer windows, where the diagram said the three-year average profit. The sources no longer name two outlets this publication does not cite.