
Analysis
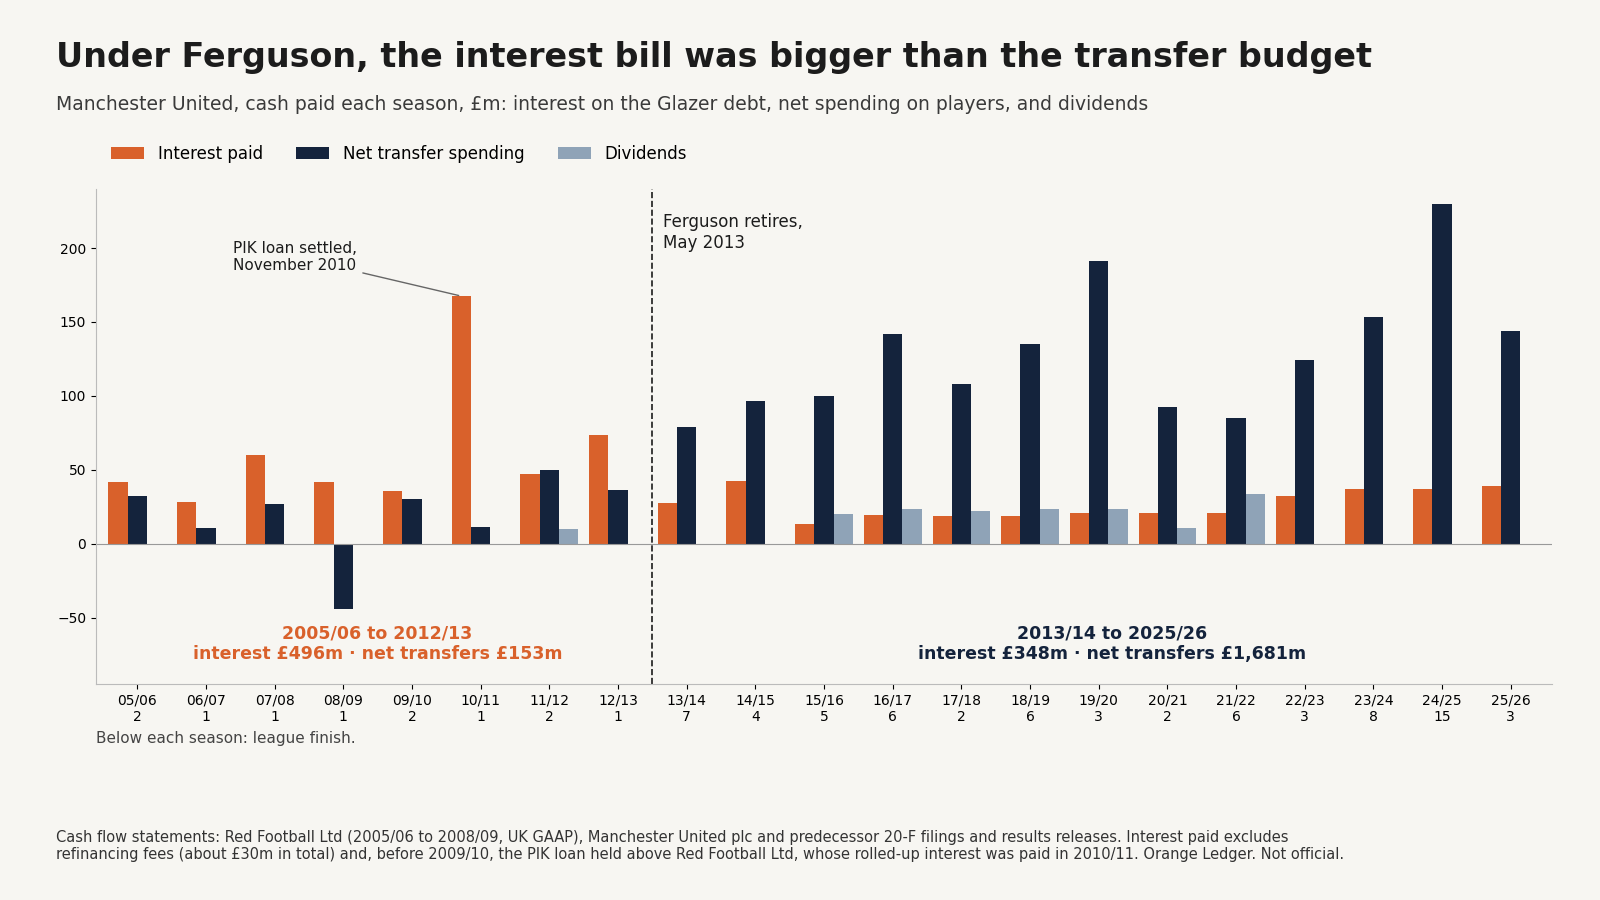
Under Ferguson, Manchester United paid more in interest than they spent on players
Twenty-one seasons of Manchester United's accounts, from the Glazer takeover in 2005 to this summer, rebuilt from the filings. In Sir Alex Ferguson's last eight seasons the club paid £496m of interest and spent £153m net on players, and won five titles. After he left, the pattern reversed: £348m of interest, £1.68bn net on players, and no title. Now the borrowing is climbing again, to its highest level since 2010, and the Premier League's new spending rule cannot see any of it.
Figures as of 16 October 2026, Orange Engine release V2BY · Latest figures · What the engine does not capture
Latest note, 2 November 2026: the estimate tested against the 2025/26 results is 59.0%, from 57.6%. All 8 correction notes are at the end.
Spend any time reading Manchester City supporters on football’s finances and you will meet the “red cartel”: Manchester United, Liverpool and Arsenal, the clubs some City fans accuse of shaping the game’s financial rules to protect their own place at the top. This piece asks a simpler question of the first of them, United: what do their own accounts show?
In the early 2000s United and Arsenal were the two great rivals of English football, and I watched that rivalry from the Arsenal side. United had the bigger stadium, Old Trafford holding nearly twice as many as Highbury, and a far bigger global reach. Arsenal decided that to keep competing they had to build a stadium of their own, and paying for the Emirates held the club back for a decade. United were held back too, by the Glazer takeover in 2005. The difference was Ferguson. He kept winning, and for eight years his results covered for the weight the club was carrying. When he left, they stopped covering for it. It was the end of a dynasty.
In Sir Alex Ferguson’s last eight seasons, Manchester United paid more in interest than they spent, net, on players. They still won the league five times.
That is the paradox at the centre of the Glazer takeover. In May 2005 the family bought the club with borrowed money, and the debt moved onto the club. For the next eight seasons United finished first or second every year, reached three Champions League finals and won one of them. So if the debt was damaging, why did it never look damaging?
| What changed after Ferguson | His last eight seasons | The thirteen since |
|---|---|---|
| Interest paid | £495.5m | £347.7m |
| Net spending on players | £153.2m | £1.68bn |
| League titles | 5 | 0 |
| Average league finish | 1.4 | 5.4 |
One thing needs saying before anything else, because it is the easiest way to misread these numbers. This is not an argument that the debt caused United’s decline. After Ferguson retired, the club spent heavily on players, more than ten times as much as before, and still did not win the league. The question here is a different one: what the debt cost in the years when Ferguson’s results made its cost easier to overlook, and what it is costing now.
The answer comes from the club’s own cash-flow statements, season by season, from the takeover to this summer. The debt was always there in the accounts. For eight years, the football kept attention elsewhere.
How the numbers were rebuilt
Every figure here comes from United’s filed accounts. For 2005/06 to 2008/09 that means Red Football Ltd, the company the Glazers bought the club through, whose accounts exist only as scanned images at Companies House; every number taken from them was read off the page and checked by hand. From 2009/10 onwards the figures come from the club’s annual reports to the US Securities and Exchange Commission and its full-year results announcements.
Three things were measured each season, all in cash actually paid or owed:
- Interest paid on the debt the takeover created, from the cash-flow statement.
- Net transfer spending: money paid for players, less money received for players sold.
- Borrowings at each 30 June, and net debt: borrowings less cash in the bank.
How the takeover was paid for
The first set of accounts, for the 14 months to June 2006, shows the purchase itself. Red Football Ltd paid £586.7m for the shares in the club. It funded that with £324.7m of share capital from its owners and £289.9m of new bank borrowing.
That was not the whole of the debt. In August 2006 the borrowing was refinanced into a senior facility arranged by JP Morgan, of up to £575m, and Red Football Ltd’s bank debt rose to £514.5m by June 2007. The same year’s accounts show £223.1m lent up to the parent company; the filings do not say what for.
Above Red Football Ltd sat a further loan, a payment-in-kind (PIK) loan of £138m. A PIK loan pays no cash interest: the interest is added to the debt each year instead, so the amount owed grows on its own. It did not cost the club cash while it rolled up, but it would have to be repaid eventually.
The debt, year by year
The picture of what United owed, at each season’s end:
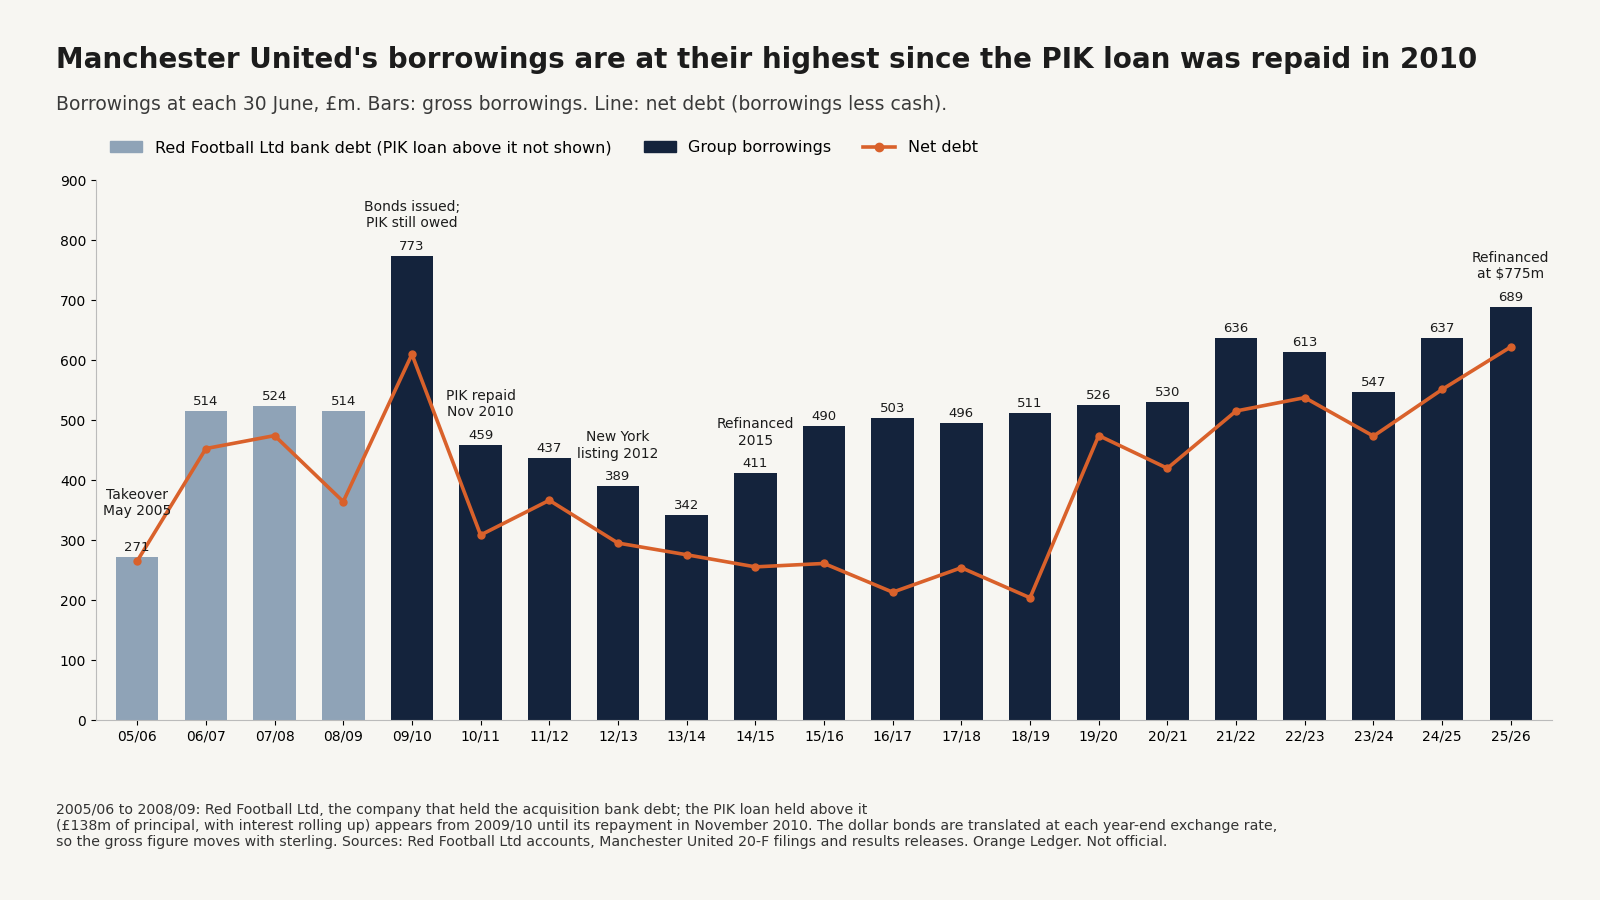
Six moments explain the shape, and each one changed what the debt meant for the club.
- 2005/06: the takeover. The purchase debt lands on the club’s own structure. From here on, the club’s earnings service a loan taken out to buy it.
- 2009/10: the peak. In January 2010 the bank debt was replaced with bonds. The accounts used from that year are the group’s, one level up from Red Football Ltd, so they are the first here to include the PIK loan. Borrowings stood at £773.3m at June 2010, the highest figure in the whole period.
- November 2010: the PIK is paid off. The accounts record a £249.1m share subscription and the repayment of the £138.0m PIK principal, with the interest that had rolled up since 2006 paid out in the same season. That is why 2010/11 shows £167.5m of interest in a single year: four years of rolled-up interest arriving at once.
- 2012: the New York listing. United floated shares on the New York Stock Exchange in August 2012, raising £70.3m for the company, much of which went on buying back bonds. The debt starts to come down.
- 2015: cheap money. The expensive bonds were replaced with $425m of notes at 3.79% and a $225m term loan. The $650m total stayed unchanged for eleven years, and interest paid settled at around £13m to £20m a season. The debt stopped growing, but it was never paid off.
- 2025/26: borrowing rises again. This summer the dollar debt was refinanced at $775m, and gross borrowings reached £689m, with net debt of £622m. Borrowings are the highest since the PIK was repaid in 2010, and net debt is the highest the chart shows, above its £610m of 2010.
The bars in the middle years move without any new borrowing, because the debt is in dollars and is translated into pounds at each year-end rate: when sterling falls, the debt in pounds rises.
Measured against the size of the business, though, the debt is much smaller than it was. At the 2010 peak, borrowings were 2.7 times the club’s revenue for the year. This summer they were about one year’s revenue. Interest took 22p of every pound United earned in Ferguson’s last eight seasons; in 2025/26 it took under 6p. The debt never went away. The club grew around it.
Ferguson’s last eight seasons: the interest bill was the bigger number
| Cash paid, £m | 2005/06 to 2012/13 (Ferguson’s last eight seasons) | 2013/14 to 2025/26 | All 21 seasons |
|---|---|---|---|
| Interest paid | 495.5 | 347.7 | 843.2 |
| Net transfer spending | 153.2 | 1,681.4 | 1,834.6 |
| Dividends | 10.0 | 156.2 | 166.2 |
| Revenue | 2,219.3 | 7,382.4 | 9,601.7 |
| Interest as a share of revenue | 22.3% | 4.7% | 8.8% |
From 2005/06 to 2012/13, United paid £495.5m in interest and spent £153.2m net on players. United paid more than £3 in interest for every £1 they spent net on players over those eight seasons. Put another way, 22p of every pound the club earned in those eight seasons went on interest. In the thirteen seasons since, it has been under 5p.
The spending on players was not small in gross terms: United paid £342.6m for players over those eight seasons. But they also received £189.4m from selling them, and two seasons show how.
- 2008/09: United made more from selling players than they spent, a net inflow of £44.0m, largely from Cristiano Ronaldo’s sale to Real Madrid. They still won the league and reached the Champions League final.
- 2010/11: the season the PIK was settled, interest reached £167.5m while net transfer spending was £11.4m. United won the league again.
Revenue roughly doubled over the eight seasons, from £173m to £363m, which is what allowed the club to carry the interest at all. What the numbers do not show is a club spending like one without the debt.
The form: what the pitch showed
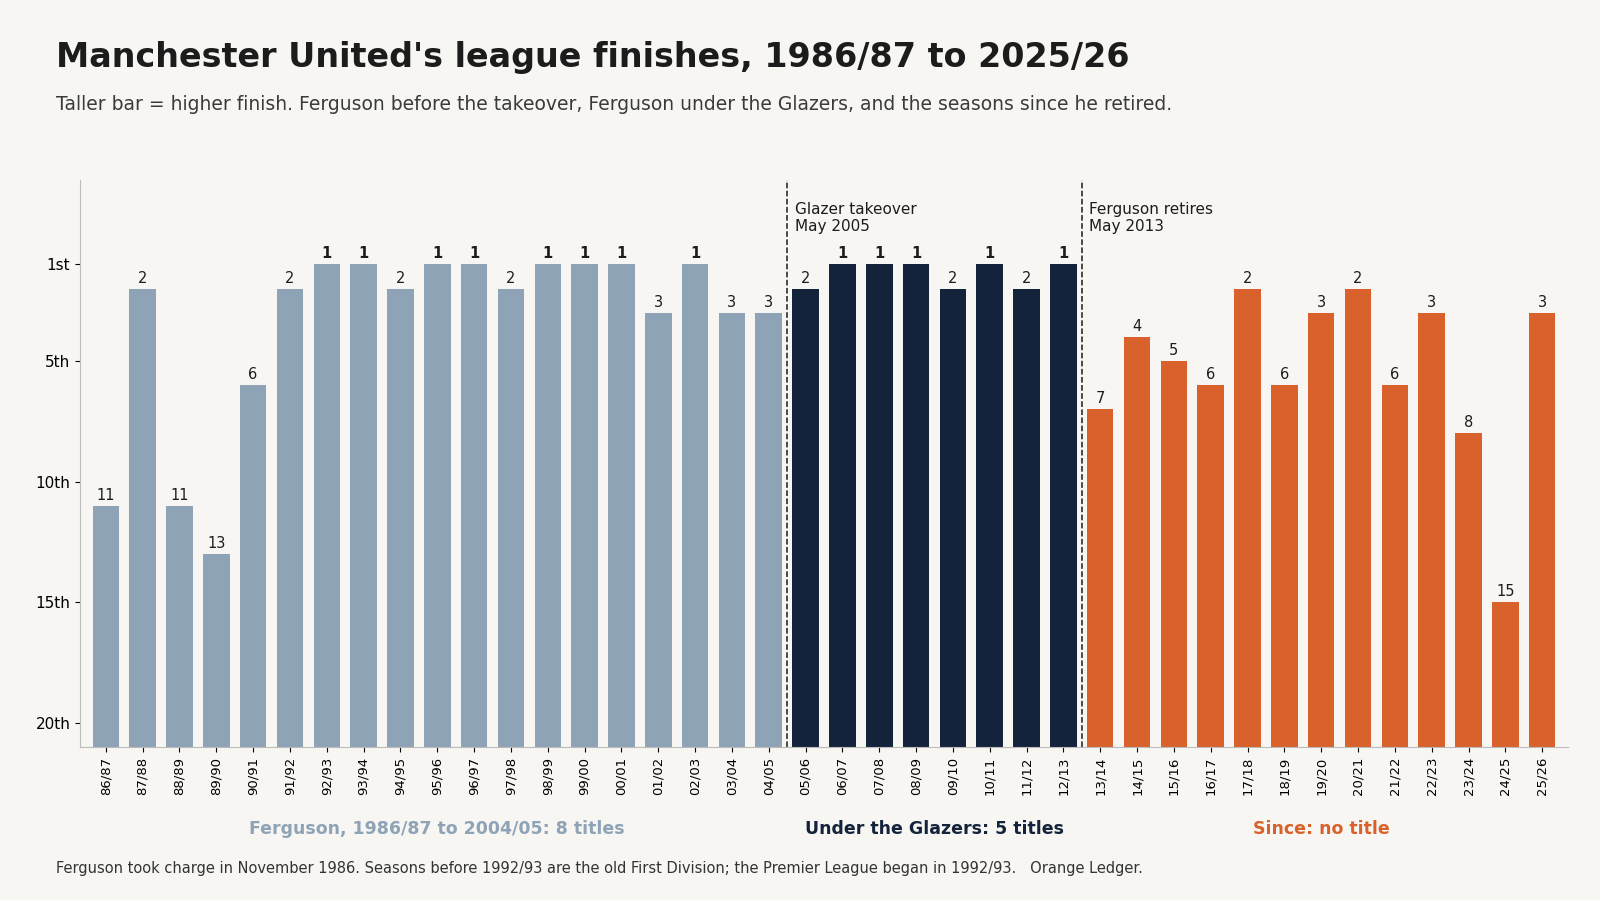
The longer view makes the point sharper. Ferguson’s teams won eight titles before the takeover and five after it, and his last eight seasons, all under the debt, were as consistent as his best years in the 1990s: never lower than second. The drop comes with his retirement, not with the Glazers’ arrival.
| Ferguson’s last eight seasons | The thirteen seasons since | |
|---|---|---|
| League titles | 5 | 0 |
| Average league finish | 1.4 | 5.4 |
| Champions League finals | 3 (won 2008) | 0 |
| Lowest league finish | 2nd | 15th (2024/25) |
Every season under the debt with Ferguson in charge ended first or second. Since he retired, United have finished between second and fifteenth, with cup wins along the way but no league title.
After Ferguson: the pattern reverses
From 2013/14 to 2025/26 the two lines swap places. Interest fell to between £13m and £43m a season once the expensive debt had been refinanced. Net transfer spending rose to £1.68bn, more than ten times the figure of Ferguson’s last eight seasons: £2.27bn paid for players against £586m received for them. Dividends started in 2011/12 and were paid every season from 2015/16 to 2021/22: £166.2m in total.
The money for players was there. What changed was everything the accounts cannot measure: the manager, the recruitment and how the club was run. That is why this piece does not claim the debt caused the decline. On these numbers, in the years after 2013, money was not the constraint.
The losses, and the cuts that followed
Money was not the constraint on players. It became one on everything else. From 2020/21 United made an operating loss five years running:
| £m | 2019/20 | 2020/21 | 2021/22 | 2022/23 | 2023/24 | 2024/25 | 2025/26 |
|---|---|---|---|---|---|---|---|
| Revenue | 509.0 | 494.1 | 583.2 | 648.4 | 661.8 | 666.5 | 677.6 |
| Staff costs | 284.0 | 322.6 | 384.2 | 331.4 | 364.7 | 313.2 | 302.0 |
| Operating result | 5.2 | (36.9) | (87.4) | (11.2) | (69.4) | (18.4) | 22.6 |
The club’s loss for 2023/24, after interest, was £113.2m, its fifth in a row. In January 2025 United wrote to supporters’ groups that they were losing money heavily every year, more than £300m over the previous three, and that without action it risked breaching the Premier League’s financial rules.
The action came from Sir Jim Ratcliffe. His company INEOS bought a 27.7% stake in 2024 and took control of football operations, and what followed was a cost-cutting programme that proved deeply unpopular with supporters and staff:
- About 450 jobs cut in two rounds of redundancies.
- Sir Alex Ferguson’s ambassador role ended, a position reportedly worth about £2m a year.
- Match tickets raised to a flat £66 for members, with no reductions for children or over-65s; the cheapest had been £40 for adults and £25 for children.
- Staff perks cut: the canteen closed, the Christmas party cancelled, funding for the former players’ association reduced.
The anger at the cuts is real, but so is the contrast with what came before. The Glazers were largely hands-off owners who left the debt on the club, and the frustration behind years of “Glazers Out” protests is easy to understand. Ratcliffe is only a minority shareholder, yet he has put money of his own into the club through new shares and taken charge of how it is run. Nor is United alone in cutting: this month Arsenal staff were reported to be facing job cuts too.
In my view, the unpopular part of Ratcliffe’s time at United is also the useful part. Supporters always want the next expensive signing. He has brought the wage bill under control and built a younger squad that can now use Champions League football to grow revenue again.
On the club’s own numbers, it worked. Staff costs fell from £364.7m in 2023/24 to £302.0m in 2025/26, and on record revenue of £677.6m United made an operating profit of £22.6m. The staff-cost line includes players’ wages, so not all of that fall is redundancies.
The cuts fell on staff and supporters, not on the debt. The second round of redundancies was reportedly expected to save about £45m a year. In 2025/26 the club paid £38.8m in interest. Twenty-one years after the takeover, the savings from cutting hundreds of jobs are roughly the size of one year’s interest bill.
What the spending rule sees, and what it does not
This is where the Premier League’s new rule enters the story. The squad cost ratio compares what a squad costs with what a club earns. On the Orange Ledger’s reconstruction, Manchester United sit at 56.9% against the 85% line, one of the most comfortable figures among the traditional big six.
The rule is built that way on purpose. It sees the squad. It does not see the balance sheet. It measures wages, transfer fees and agents’ fees against revenue; interest, debt repayments and dividends appear nowhere in it. A club can carry any amount of debt and still sit well inside the line.
The cash tells a different story. Take the cash the club generated from running its business, then subtract interest, net transfer spending and spending on facilities:
| £m | 2023/24 | 2024/25 | 2025/26 |
|---|---|---|---|
| Cash generated from operations | 117.5 | 107.5 | 216.2 |
| Interest paid, less interest received | (35.5) | (33.8) | (36.7) |
| Net transfer spending | (153.7) | (229.9) | (143.7) |
| Spending on facilities | (17.5) | (44.7) | (85.9) |
| Shortfall | (89.2) | (200.9) | (50.1) |
The shortfalls were covered by new shares from Sir Jim Ratcliffe’s INEOS, £158.5m and £80.0m, and by borrowing: the revolving credit facility reached £290m in December 2025. The 2025/26 figure includes £63.5m for land for a proposed new stadium, and it is flattered by the sale of transfer fees owed to United by other clubs, cash brought forward rather than earned.
This summer’s refinancing takes the borrowing to its highest since the PIK years. The difference is that this time part of it is paying for an asset.
My view is that the Glazer model was parasitic. The club was bought with borrowing that the club itself then had to service, and since 2005 it has paid out £843m in interest and £166m in dividends. Ferguson made that model look sustainable, because a club winning the league every other year could carry almost anything. The Premier League’s new spending rule would make it look sustainable today, for a different reason: it does not look.
What this doesn’t say
- That the debt caused United’s decline after 2013. Net transfer spending rose sharply after Ferguson left; the results show that money was not the constraint in those years.
- That Ferguson or the club concealed anything. The costs were in the published accounts throughout. The point is that success on the pitch kept attention elsewhere.
- That the interest total is the whole cost of the takeover. It excludes about £30m of refinancing fees, and before 2009/10 it covers only the company that held the bank debt, not the PIK loan above it, whose rolled-up interest appears in 2010/11.
- Anything about the Glazers’ motives or returns. This is the club’s cash, not the owners’.
What it does say
- In Ferguson’s last eight seasons United paid £495.5m in interest, 22p of every pound of revenue, and spent £153.2m net on players, and won five titles.
- Across all 21 seasons since the takeover, the club has paid £843.2m in interest and £166.2m in dividends.
- Borrowings reached £689m this summer, the highest since the PIK was repaid in 2010.
- The squad cost ratio cannot see any of it, which is why United look comfortable under the new rule while running cash shortfalls of £89m, £201m and £50m in the last three seasons.
Ferguson never made the debt disappear. He made United successful enough that the debt never defined the conversation. Since he left, the club has lived on what he built: a legacy and a global brand that kept revenue rising, from £363m in his last season to a record £678m last season, through thirteen years without a league title. I am still struck, every time I am in South East Asia, by how many Manchester United shirts I see. That following is the asset the takeover was borrowed against, and it has carried the club when the football could not.
United now have every ingredient for a comeback: the brand, the revenue, a new stadium in planning and, after the low of fifteenth in 2024/25, third place and Champions League football again. The debt is still there, and the spending rule still cannot see it. But money has rarely been what held United back since Ferguson left. Whether they can stay at the top comes down, as it has for thirteen years, to the football.
Sources and caveats.
2005/06 to 2008/09. Red Football Ltd (company 5370076), consolidated accounts filed at Companies House, UK GAAP. The 2005/06 accounts cover the 14 months from incorporation on 18 February 2005 and include the takeover. Borrowings for these years are Red Football Ltd's bank loans, and exclude the PIK loan held above it; the net debt they give matches the figure stated in each year's directors' report. Read from scanned filings and checked by hand.
2009/10 to 2016/17. Manchester United plc and predecessor (Red Football Shareholder Ltd) annual reports on Form 20-F for fiscal 2012, 2013, 2015 and 2018: cash-flow statements, selected financial data, net debt reconciliations and the finance-costs note, which records the PIK loan's repayment on 22 November 2010.
2017/18 to 2025/26. Manchester United plc fourth-quarter and full-year results releases, which give two years each; 2017/18 as restated for the 2018 revenue standard.
Definitions. Net transfer spending is cash paid for player registrations less cash received from their sale. Interest paid is cash interest from the cash-flow statement, excluding refinancing and issue costs. The 2005/06 dividend of £3.5m in the Red Football Ltd accounts is excluded from the dividend total. Borrowings are at the balance sheet date, with the dollar debt translated at that date's exchange rate. The shortfall table uses cash generated from operations, after working-capital movements, which can move substantially between years.
The INEOS cost-cutting. The redundancies, the end of Sir Alex Ferguson's ambassador role, the ticket prices and staff cuts are as reported by The Athletic, BBC Sport, AFP and ESPN between 2024 and 2026; the club's January 2025 letter to supporters' groups as reported by ESPN; the expected saving from the second round of redundancies as reported by BBC Sport; the possible job cuts at Arsenal as reported in September 2026. The 2023/24 loss of £113.2m is as reported at the time. Operating results and staff costs are from the dataset; staff costs include players.
The squad cost ratio. Manchester United's 56.9% is the Orange Ledger's estimate for the 1 March 2027 test, built on the 2024/25 accounts; tested against the 2025/26 results it is 59.0%.
Independent analysis, not official, and not advice. The full season-by-season dataset is held with the Orange Engine.
Corrections and updates (8)
3 October 2026 · Data correction · several figures: see the note
Update, 3 October 2026. Manchester United’s squad cost ratio is now 58.1%, from 58.7%, after home matches were counted from match reports (How we estimate matchday revenue). A separate review of agents’ fees on signings since the last accounts is under way and may raise this figure; we will report its result.
4 October 2026 · Methodology change · several figures: see the note
Update, 4 October 2026. Manchester United’s squad cost ratio is now 58.8%, from 58.1%, after registrations were counted at the reported fee plus 12% and merchandise at gross profit, and cup prize money was rebuilt from each club’s cup ties (Three definitions in the squad cost rule, and what they change).
5 October 2026 · Methodology change · several figures: see the note
Update, 5 October 2026. Manchester United’s squad cost ratio is now 59.0%, from 58.8%, after contract lengths were measured from their dates (the engine changelog).
5 October 2026 · Regulatory interpretation · several figures: see the note
Update, 5 October 2026. Manchester United’s squad cost ratio is now 57.3%, from 59.0%, after the estimate was built on the accounts of the group the rule describes, where it had been built on the club company’s (the engine changelog).
6 October 2026 · Data correction · several figures: see the note
Update, 6 October 2026. The estimate tested against United’s 2025/26 results is now 57.5%, from 57.6%, after a correction to the staff costs it is measured against (the engine changelog). The 57.3% is unchanged.
16 October 2026 · Assumption revision · several figures: see the note
Updated 16 October 2026: loans out now recorded; wage relief shown in ranges. Manchester United’s squad cost ratio is now 56.9%, from 57.3%, after its loan wages were rebuilt from a record of every loan spell; the estimate tested against the 2025/26 results is unchanged at 57.5% (the engine changelog).
25 October 2026 · Data correction · no figure changed
Correction, 25 October 2026. No figure in the accounts changed. The chart’s description said net debt peaked at £610m in 2010; at £622m in 2026 it is higher, the highest the chart shows, and the text now says so where it said both measures were the highest since 2010. Borrowing was said to be rising for the first time since the PIK years, but it rose to £636m in 2022; it is now at its highest since then. The results test’s figure is 57.6%, from 57.5%, after that piece’s corrections of 23 October. And the opening promised a series taking each of three clubs in turn, which has not followed; it now describes this piece only.
2 November 2026 · Data correction · no figure in this article's accounts changed
Correction, 2 November 2026. The estimate tested against United’s 2025/26 results is 59.0%, from 57.6%: it had taken Rasmus Højlund, whose sale United booked in 2025/26, out of the results a second time (Testing our Manchester United forecast). United’s main estimate, 56.9%, and every figure from the accounts here are unchanged.