
Manchester United · Financial analysis
Testing our Manchester United forecast, on the group's accounts
In September the Orange Ledger estimated Manchester United's squad cost ratio (SCR) for the 1 March 2027 test at 58.7%. United's 2025/26 results, audited in the plc's annual report, let us test that forecast against real numbers. The updated estimate is 59.0%, with a range of 56.1% to 61.5%, built on the group's accounts. The results confirmed the revenue estimates, showed a book value of registrations above the September projection, gave a higher estimate of player wages, and led us to correct how loan wages are counted, a correction now worth 0.4 points downward, which is set out here in full. The SCR is comfortable. The rules United's lenders impose are not.
Figures as of 23 October 2026, Orange Engine release V2CB · Latest figures · What the engine does not capture
SCR 2026/27·Accounts update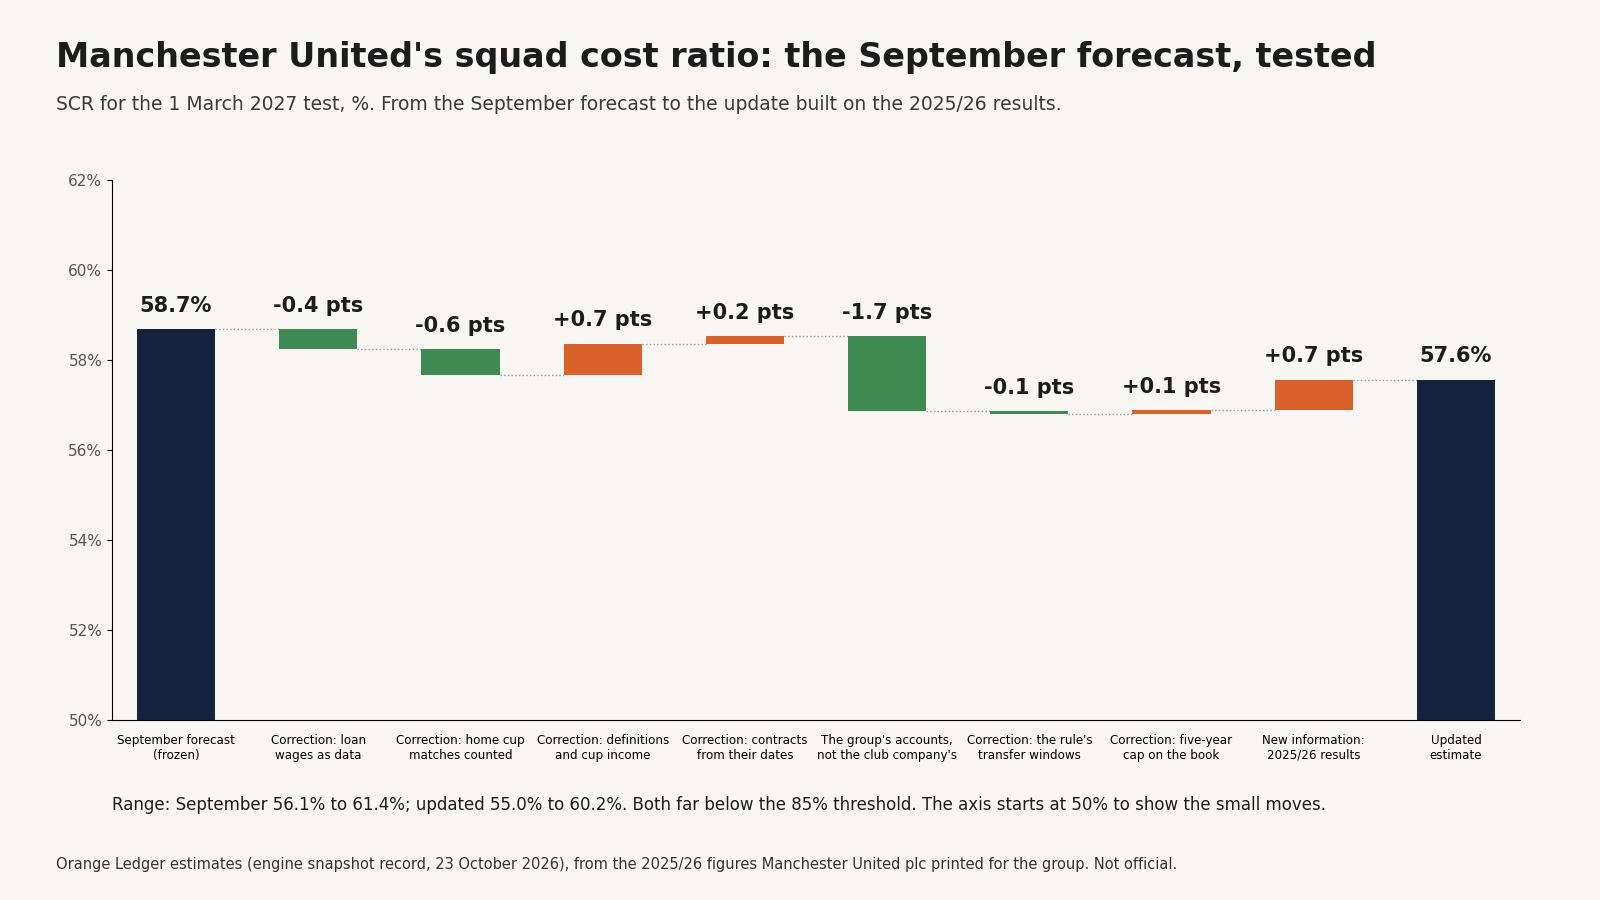
Latest change to the figures, 2 November 2026: the update is 59.0%, from 57.6%, because Rasmus Højlund’s sale had been taken out of United’s results twice. All 11 correction notes are at the end.
On 20 September the Orange Ledger rebuilt Manchester United’s squad cost ratio (SCR) for the Premier League’s first test on 1 March 2027 and put it at 58.7%. That forecast was built on the club’s 2024/25 accounts, the latest filed at the time, rolled forward to 2026/27.
United report much earlier than most Premier League clubs, because the plc is listed in New York. Its 2025/26 results came out on 23 September, and the audited annual report (the Form 20-F) followed on 30 September. That gives us something most clubs’ figures do not yet allow: a test of our own forecast against real numbers for the year it had to estimate.
This is that test. The short answer is that the update, 59.0%, is 0.3 points above the forecast, and that the closeness is not evidence of an accurate forecast. Reading the group’s accounts took 1.7 points off, the other corrections roughly cancelled, and the 2025/26 results, compared like for like, added 2.1 points. This article sets out each.
What this update is built on
When this article was first published, United’s SCR was built on the club company, Manchester United Football Club Limited, and each of the plc’s figures was converted to it. That has changed.
- The SCR for United is now built on the group the rule describes. The rule tests a club together with its football companies. For United that is the group that holds the club company, the merchandising and media companies and the women’s club. In 2024/25 the group’s revenue was £666.5m; the club company’s was £600.7m.
- The plc’s results are for that group, so they are used as printed. No figure is converted.
- The September forecast of record is not rewritten. It was made on the club company’s accounts, and it stays at 58.7%. The move to the group’s accounts is shown as a step of its own in the bridge below.
Some things are still not known. The player wages inside the group’s staff costs are an estimate, as they were inside the club company’s. The plc’s figure for registrations includes the women’s team’s, about 0.2% of the total. The club company’s own 2025/26 accounts, which hold the men’s squad’s registrations, are likely to be filed early in 2027. The figures used here are those of the plc’s audited annual report (Form 20-F), and the group is the basis the rule describes, so this article is United’s 2025/26 accounts checkpoint.
The result
| Manchester United, 1 March 2027 test | September forecast | Updated |
|---|---|---|
| Squad cost ratio (the rule’s figure) | 58.7% | 59.0% |
| Before profit on player sales | 61.9% | 61.9% |
| Squad costs | £438.5m | £455.9m |
| Revenue counted by the rule | £708.7m | £736.4m |
| Three-year average profit on player sales | £38.6m | £36.5m |
| Range | 56.1% to 61.4% | 56.1% to 61.5% |
The two columns are on different accounts: the September forecast on the club company’s, the update on the group’s. Revenue is the line where that shows.
The ratio is squad costs divided by the revenue the rule counts plus the three-year average of profit on player sales: £455.9m against £736.4m plus £36.5m gives 59.0%. Without the player-sale profit, the same costs against revenue alone give 61.9%. Either way, United are far below the 85% threshold, so the headline does not change: United have about £201m of room under the rule.
The 0.3-point net change is made of eight moves: a correction of our own method for loan wages that takes 0.4 points off, the corrected count of home cup matches, which takes off 0.6 points, the rule’s own definitions, which add 0.7 points between them (a registration costs the reported fee plus 12% for players signed since the last accounts, where we had counted the fee alone, and income from the domestic cups is rebuilt from United’s cup ties over three seasons and the FA’s published prize fund and broadcast fees, a provisional figure lower than the one we had entered), contract lengths measured from the day a player was registered to the day his contract ends, which add 0.2 points, the move from the club company’s accounts to the group’s, which takes off 1.7 points (the group’s revenue is higher, its merchandise counts at its profit, and the wages estimated for the squad are unchanged), the transfer windows the rule names, which take off 0.1 points (the rule averages the profit on sales in the six most recent transfer windows, which for this test start on 2 February 2024, and that brings in Álvaro Carreras’s sale to Benfica in May 2024), the five-year cap on contracts already in the book value, which adds 0.1 points (Rule A.1.22(c) spreads a fee over no more than five years for any contract signed since 12 December 2023, and four of United’s run slightly longer), and the new information from the results, which pushes it up by 2.1 points.
The correction we owe readers: loan wages
When a club loans a player out, the club borrowing him usually pays part of his wages. The September forecast handled those savings with a few entries set by hand. They are now rebuilt from a sourced record of every loan spell: who paid what share of which player’s wages, and for how long.
Two things decide the result. This season, Trabzonspor are reported to pay all of André Onana’s wages and Celta Vigo all of Altay Bayındır’s, which lowers United’s squad cost. And a loan in 2024/25 lowered the staff costs in the accounts the forecast rolls forward, so where the player is back, or left and was taken out of the wage bill at his full salary, that saving is added back: for United, Marcus Rashford’s loan to Aston Villa. Jadon Sancho’s 2024/25 loan to Chelsea is not added back, because our wage bridge takes him out of the squad at the lower cost when he leaves. Where nobody states how much of a loaned player’s wage the borrowing club pays, as for United’s young players out on loan this season, the saving widens the range and does not move the central figure.
- With loan wages treated as data, the September information gives 56.9%, not 57.3%. Both figures use the corrected count of home cup matches, the rule’s definition of registration cost, the rebuilt cup income, contract lengths measured from their dates and the group’s accounts. The estimate of player wages falls from £235.9m to £232.4m. United’s main estimate now uses the same record, so it printed 56.9% too.
The published 58.7% stays as it was, as the September forecast of record: the Orange Ledger does not rewrite forecasts after the event. When this article was first published, this section said the method behind it understated United’s wages by about £7m, mostly through Sancho; that was wrong, as the correction of 16 October above explains.
What the 2025/26 results confirmed
The results let us check several of the September estimates directly.
- Commercial income. The rule counts commercial income at last season’s figure, so for 2026/27 that means 2025/26. The forecast estimated £250.0m for the club company. With the £60.8m of commercial income earned outside the club company in 2024/25 added, that is £310.8m for the group. The group printed £317.3m: sponsorship £160.5m, and retail, merchandising, apparel and product licensing £156.8m. The group’s sponsorship income fell by 14.8%, mainly because the training kit deal with Tezos ended, but retail and licensing grew. On sales the forecast was about £6.5m low; at the rule’s measure it was £1.1m high, as set out below.
- Matchday income. The forecast estimated £155.0m for the club company, which is £153.2m on the group’s matchday line. The group printed £153.6m.
- League position. United finished third in 2025/26, which the forecast already assumed, and the group’s broadcasting income rose by 19.5%, helped by the third-place finish, despite a season without European football.
The revenue the rule counts is now £736.4m, against £708.7m in the forecast of record. Most of that rise is the move to the group’s accounts, and the rest comes from the earlier corrections to the count of home cup matches and to cup income. The results themselves leave it almost unchanged, at £736.4m against £737.0m on the September information. Retail costs rose from £36.6m to £44.2m as sales rose, so commercial revenue at the rule’s measure, sales less the cost of the goods, is £273.1m against the estimate’s £274.2m: the higher sales and the higher cost of them nearly cancel.
What the results corrected
- The squad’s book value. The value of player registrations in the accounts drives the transfer-fee cost that is spread over contracts. The September model projected £435.1m for the men’s squad at 30 June 2026. The plc printed £452.3m, with Højlund already sold: £17.2m, or 3.8%, more. The two are not on the same perimeter. The plc’s figure is the group’s, with the women’s team’s registrations (£1.1m in 2024/25) and possibly those of football management staff, so the men’s squad’s own difference is not known exactly. United’s notes expect £156.1m of that book value to be charged in 2026/27, before the summer’s transfers; this reconstruction charges £146.5m on it, spreading it over an average remaining life, about £9.6m less, and adds £35.8m for the summer’s signings. Rebuilt in that way, the 2026/27 charge for spreading transfer fees is £182.3m, against £187.0m on the September information counted the same way (the forecast of record printed £181.2m).
- Rasmus Højlund’s sale. United booked his permanent move to Napoli in 2025/26, as the forecast assumed: the annual report attributes the year’s £46.9m of disposal profit mainly to his and Alejandro Garnacho’s sales, and the registrations United sold after 30 June 2026 carried only £0.7m of book value. The year’s disposal profit came in below the forecast, so the three-year average of profit on player sales is £36.5m, against £38.2m on the September information. Both count Álvaro Carreras’s sale to Benfica in May 2024, because the rule averages the transfer windows from 2 February 2024.
- Wages. Starting from 2025/26 instead of 2024/25, the estimate of player wages for 2026/27 comes out at £252.1m, £19.7m higher than the corrected September route. Both are reconstructions of 2026/27 player wages, not figures from the accounts: United’s total staff costs fell in 2025/26, to £302.0m from £313.3m. The two routes should agree, and the Orange Ledger has not been able to explain the difference with loans, transfers or contract renewals. It is shown here rather than forced away, and it is one of the three things that decide the range.
The net effect of the new information is 2.1 points upward: a wage estimate £19.7m higher and a sale-profit average £1.7m lower outweigh a transfer-fee charge £4.7m lower, and the revenue the rule counts is almost unchanged.
What drives the range
The updated range is 56.1% to 61.5%. Three estimates decide where in that range the true figure sits:
- The players’ share of the wage bill. The accounts report staff costs for all employees; the players’ share is estimated, not disclosed.
- The Champions League pay rise. United’s player contracts reportedly restore pay cut during seasons without the Champions League. The update assumes £20m to £40m.
- The £19.7m wage difference described above.
None of them comes close to changing the conclusion. The central estimate sits 26.0 percentage points below 85%, and even the top of the range remains 23.5 percentage points below it.
The rules that actually bind United
The SCR says United have around £201m of room. United’s lenders take a much stricter view, and the 2025/26 annual report sets out their terms.
In June 2026 United issued $550m of new notes at 5.36%, due in 2031. As Jamie Bajwa sets out in his analysis of the loan terms at Sub-Prime Goals, they come with conditions the Premier League’s rule does not have:
- Minimum earnings of £125m over each twelve months, measured before interest, tax, depreciation, amortisation, player trading and exceptional items, and without the lease accounting of IFRS 16, tested every quarter. Rebuilt from the audited accounts, United’s figure for 2025/26 is about £216m; the lenders’ own calculation is not published, and the annual report says United complied in every quarter.
- A Champions League safety net that lets United add back part of the lost income in a season without the Champions League, but only twice while the notes are outstanding, and never in consecutive years.
- Limits on new borrowing tied to earnings, with more room only for debt raised for a new stadium.
And the results themselves show why the lenders watch closely. United finished third, with no European fixtures to pay for, and still lost £47.0m before tax. Without £46.9m of profit from selling players, which United’s annual report attributes mainly to Alejandro Garnacho’s sale to Chelsea and Højlund’s to Napoli, the operating result would have been a loss of £24.2m. Borrowings stood at £689.0m at 30 June 2026, and, as the Orange Ledger’s article on the Glazer years showed, cash after investment and transfers fell short again, by about £50m.
This is the gap the Orange Ledger’s regulation series keeps returning to. The SCR measures what a club spends on its squad against its revenue. It does not see debt, interest or the cost of a new stadium. United pass the Premier League’s test with ease, while living under a much tighter set of rules written by the people they owe money to.
What this doesn’t say
- That 59.0% is United’s official figure. The League does not publish club ratios, and the club company’s own 2025/26 accounts are not yet filed.
- That the group’s accounts give the men’s squad’s costs directly. The player wages inside the group’s staff costs are estimated, and the plc’s registrations include the women’s team’s, about 0.2% of the total.
- That the wage difference has been explained. It has not.
Sources and caveats.
The results. Manchester United plc, annual report on Form 20-F for the year ended 30 June 2026 (filed 30 September 2026), and the fourth-quarter results release of 23 September 2026 (SEC Form 6-K, exhibit 99.1). The audited 20-F figures match the preliminary release used for the update: revenue £677.6m, employee benefit expenses £302.0m, amortisation £211.8m, profit on disposal £46.9m, registrations book value £452.3m. EBITDA of £216.4m is calculated from the audited income statement on the covenant's definition, except that it keeps the effect of IFRS 16, which the covenant leaves out (right-of-use depreciation was £0.8m), so it is not the lenders' tested figure. Højlund's sale in 2025/26: the 20-F's operating review and its notes 8, 16 and 33.
The basis. The estimate is built on the group the rule describes: Red Football Limited's accounts for 2024/25 and the figures Manchester United plc printed for 2025/26, used as printed. No figure is converted to the club company. Retail costs (£36.6m in 2024/25, £44.2m in 2025/26) are taken off commercial revenue, because the rule counts merchandise at its profit; MU RAML Limited's accounts for 2024/25 print a cost of inventories sold of £37.5m. The registrations for 2024/25 are the club company's, the men's squad; the plc's for 2025/26 include the women's team's, about 0.2% of the total.
The loan terms. The 20-F's description of the senior secured notes, and Jamie Bajwa, Sub-Prime Goals, "Can INEOS clear Manchester United's debt and build a New Old Trafford?" (30 September 2026).
The engine. All three estimates come from the Orange Engine's snapshot record for United (engine version V2CB, 23 October 2026): the frozen September forecast, read unchanged from the snapshot of record published on 30 September 2026, the September information with loan wages as data, and the update on the 2025/26 results. No figure in the tables is typed by hand. The September article now carries the corrected count of home cup matches, the rule's definition of registration cost, the rebuilt cup income, contract lengths measured from their dates, the group's accounts, the record of loans out, the transfer windows the rule names and the five-year cap on contracts already in the book value, and prints 56.9% (56.883); the forecast of record is the 58.7% (58.687) it published. The loan-wage step of the bridge is the main estimate of 16 October, 56.9% (56.864), against the 57.3% (57.313) it printed before; the transfer-window step is the main estimate of earlier on 23 October, 56.8% (56.805), against that 56.9%, and the five-year-cap step is the main estimate now, 56.9% (56.883), against 56.8%.
Independent estimate, not an official calculation, and not advice.
Corrections and updates (11)
2 October 2026 · Data correction · several figures: see the note
Correction, 2 October 2026. The updated estimate is restated at engine version V2BI: 58.6%, from 58.5%. The three-year average profit on player sales is £39.4m, from £39.9m, and the central estimate sits 26.4 points below 85%, from 26.5. The change comes from United’s transfer records: two academy players who joined Arsenal in August 2026, Habeeb Ogunneye and James Scanlon, had been carried at estimated fees and are now recorded as free transfers with sell-on clauses, as Arsenal also records them. The September forecast column is unchanged: it is read as published from the engine’s snapshot of record. The range, 56.0% to 61.3%, the 0.9-point correction and the 1.1-point effect of the results are unchanged.
3 October 2026 · Data correction · several figures: see the note
Correction, 3 October 2026. The updated figure is 58.0%, from 58.6%. The September forecast of record stays at 58.7%: we do not rewrite a forecast after the event. What has changed is a count the forecast and the update both used. The rule counts the average number of home FA Cup and League Cup matches over the last three seasons, rounded up; United played eight in three seasons, so the rule counts three, where we had assumed two. That adds £7.8m to the revenue the rule counts and takes 0.6 points off every stage: the September forecast, re-run on the corrected count, gives 58.1%; the September information with loan wages as data gives 59.0%, from 59.6%; and the update gives 58.0%. The error was ours, in a count we had not checked, and it sat on both sides of the comparison. A separate review of agents’ fees on signings since the last accounts is under way and may raise this figure; we will report its result.
4 October 2026 · Methodology change · several figures: see the note
Correction, 4 October 2026. The updated estimate is now 58.5%, from 58.0%, with a range of 55.9% to 61.2%, from 55.4% to 60.7%, after registrations were counted at the reported fee plus 12% and merchandise at gross profit, and cup prize money was rebuilt from each club’s cup ties (Three definitions in the squad cost rule, and what they change). The September forecast of record stays at 58.7%. The rule’s definition of registration cost and the rebuilt cup prize money add 0.7 points to the two September stages and 0.5 to the update: the September forecast, re-run on them, gives 58.8%, from 58.1%; the September information with loan wages as data gives 59.7%, from 59.0% (range 57.1% to 62.4%, from 56.5% to 61.8%); and the update gives 58.5%. In the update, squad costs are now £444.9m, from £442.2m; the yearly charge for transfer fees is £171.4m, from £168.6m; the three-year average profit on player sales is £38.4m, from £39.4m; before profit on player sales the ratio is 61.6%, from 61.1%; the room under the rule is about £201m, from about £206m; the effect of the 2025/26 results is 1.2 points, from 1.1; and the September model’s book value ran about 3.0% high, from 2.3%. Nothing is taken off United’s commercial revenue; the revenue the rule counts is now £722.0m, from £723.3m. This is the result of the review of agents’ fees that the note above promised.
5 October 2026 · Methodology change · several figures: see the note
Correction, 5 October 2026. The updated estimate is now 58.6%, from 58.5%, with a range of 56.0% to 61.3%, from 55.9% to 61.2%. The September forecast of record stays at 58.7%. We now measure each contract from the day the player was registered to the day it ends. A player who signs in August on a five-year deal has a contract of four years and ten months, because contracts end on 30 June; we had spread his cost over five full years. That adds 0.2 points to the two September stages and 0.1 to the update: the September forecast, re-run on it, gives 59.0%, from 58.8%; the September information with loan wages as data gives 59.9%, from 59.7% (range 57.3% to 62.6%, from 57.1% to 62.4%); and the update gives 58.6%. In the update, squad costs are now £445.6m, from £444.9m; the yearly charge for transfer fees is £172.0m, from £171.4m; before profit on player sales the ratio is 61.7%, from 61.6%; and the effect of the 2025/26 results is 1.3 points, from 1.2. Most clubs move because contract costs are now measured to their actual or derived expiry dates; six also move for club-specific reasons. See the engine changelog.
5 October 2026 · Regulatory interpretation · several figures: see the note
Correction, 5 October 2026. The updated estimate is now 57.6%, from 58.6%, with a range of 54.9% to 60.1%, from 56.0% to 61.3%. The September forecast of record stays at 58.7%. The estimate is now built on the group the rule describes, so the plc’s results are used as printed. The rule tests a club together with its football companies. We had built United’s estimate on the club company and converted each of the plc’s group figures to it, on the 2024/25 relationship between the two. That conversion is gone. Reading the group’s accounts takes 1.7 points off the two September stages and 1.0 off the update: the September forecast, re-run on them, gives 57.3%, from 59.0%; the September information with loan wages as data gives 58.2%, from 59.9% (range 55.5% to 60.8%, from 57.3% to 62.6%); and the update gives 57.6%. The bridge from the forecast of record takes a new step for it, 1.7 points down, and now has six moves. In the update, the revenue the rule counts is now £736.4m, from £722.0m, after £44.2m of retail costs is taken off commercial revenue, because the rule counts merchandise at its profit; squad costs are £446.1m, from £445.6m; the yearly charge for transfer fees is £172.3m, from £172.0m; the three-year average profit on player sales is £38.5m, from £38.4m; before profit on player sales the ratio is 60.6%, from 61.7%; the room under the rule is about £213m, from about £201m; the effect of the 2025/26 results is 0.6 points, from 1.3; and the September model’s book value ran about 2.8% high, from 3.0%. The wages estimated for the squad on the September routes do not change. See the engine changelog.
6 October 2026 · Data correction · several figures: see the note
Correction, 6 October 2026. The updated estimate is 57.5%, from 57.6%, with a range of 55.0% to 60.3%, from 54.9% to 60.1%. The September forecast of record stays at 58.7%, and the club’s main estimate stays at 57.3%. The share of staff costs we count as player wages is now worked out from the same table it is applied to. To count the same player wages on the group’s accounts we apply a share to the group’s total staff costs. We had worked that share out against Red Football Limited’s staff costs for 2024/25, £312.9m, and applied it to the £302.0m the plc printed for 2025/26. The plc’s table includes share-based payments, which Red Football’s does not, and the plc’s own total for 2024/25 is £313.3m. The share is now worked out against that figure. The wages estimated for 2026/27 from the 2025/26 results are £252.1m, from £252.3m; squad costs are £445.9m, from £446.1m; the difference between the two wage routes is £9.3m, from £9.5m; and the effect of the 2025/26 results is 0.7 points, from 0.6. We found this by reading every filed figure in our revenue files against its page a second time. The range now allows for the head coach’s exit. United’s 2025/26 accounts show £5.2m of costs for loss of office in the year Ruben Amorim left, without saying how much of it was his. The rule counts a manager’s termination payment as squad cost, whatever the accounts call it. So the range now allows for anything between none of the £5.2m and all of it; the central estimate includes none, and would be up to 0.7 points higher if all of it were his. See the engine changelog.
16 October 2026 · Assumption revision · several figures: see the note
Updated 16 October 2026: loans out now recorded; wage relief shown in ranges.
16 October 2026 · Assumption revision · several figures: see the note
Correction, 16 October 2026. The updated estimate stays at 57.5%; its range is 54.9% to 60.2%, from 55.0% to 60.3%. The September forecast of record stays at 58.7%. The loan-wage correction this article described is now 0.4 points down, not 0.9 up. We had added back the half of Jadon Sancho’s 2024/25 wages that Chelsea paid, because the accounts we roll forward were lowered by it. But our wage bridge takes him out of the squad at that lower cost when he leaves, so adding the saving back counted part of his wage twice. We now add a loan saving back only where the player is back at the club or was taken out of the wage bill at his full salary; for United that is Marcus Rashford’s loan to Aston Villa. Every loan out at every club is now recorded, so United’s main estimate takes its loan wages from the same record and prints 56.9%, from 57.3%; the September information with loan wages as data gives the same 56.9%, from 58.2%, with player wages of £232.4m, from £242.8m. The 2025/26 results now move the estimate 0.7 points up, where they moved it 0.7 down. The wages built from the 2025/26 accounts are unchanged at £252.1m, so the difference between the two wage routes is now £19.7m, from £9.3m. It is still unexplained, and it is still one of the things that decide the range. The range also allows for the wages of United’s young players out on loan this season, whose split no source states. See the engine changelog.
23 October 2026 · Methodology change · several figures: see the note
Correction, 23 October 2026. The updated estimate stays at 57.5%, with its range of 54.9% to 60.2%, and the September forecast of record stays at 58.7%. The forecast came within 1.2 points of the update, not 1.1. The rule averages the profit or loss on player sales in the six most recent transfer windows (Rules A.1.13 and A.1.53), and for the March 2027 test that period starts on 2 February 2024. We had averaged three financial years starting on 1 July 2024, so Álvaro Carreras’s sale to Benfica in May 2024, a profit of about £2.4m, was left out. Counting it is a seventh step in the bridge, 0.1 points down; the other six steps are unchanged.
- Moved: the update’s three-year average of sale profit is £39.3m, from £38.5m. United’s main estimate, which this article quotes, is 56.8%, from 56.9%. The waterfall chart and the cover are redrawn.
- The conclusion holds: most of the difference between the forecast and the update is still the move to the group’s accounts. See the engine changelog.
23 October 2026 (second) · Methodology change · several figures: see the note
Correction, 23 October 2026 (second of the day). The updated estimate is 57.6%, from 57.5%, and its range 55.0% to 60.2%, from 54.9% to 60.2%. Rule A.1.22(c) caps the spreading of a transfer fee at five years for any contract executed since 12 December 2023. We applied the cap to signings since the last accounts, but not to registrations already in the book value. Four of United’s run slightly longer than five years, Patrick Dorgu’s the largest, and charging them over five years adds £0.6m to the transfer-fee charge on the September information, now £187.0m, and on the results, now £172.9m. The squad costs £446.5m on the update, from £445.9m.
- The bridge has an eighth step: the cap adds 0.1 points, after the transfer windows. The other seven steps are unchanged, and the net change from the September forecast is 1.1 points, from 1.2. United’s main estimate, which this article quotes, is 56.9%, from 56.8%.
- Unchanged: the September forecast of record, 58.7%, and the conclusion. The waterfall chart and the cover are redrawn. See the engine changelog.
2 November 2026 · Data correction · SCR 57.6% → 59.0% · before player sales 60.6% → 61.9%
Correction, 2 November 2026. The updated estimate is 59.0%, from 57.6%, with a range of 56.1% to 61.5%, from 55.0% to 60.2%. The September forecast of record stays at 58.7%. We took Rasmus Højlund out of United’s results twice. The update dated his permanent move to Napoli in 2026/27, inferring it from the small disposal profit United booked between April and June 2026. The annual report shows otherwise: it attributes the year’s disposal profit mainly to Garnacho’s and Højlund’s sales, and the registrations disposed of after 30 June 2026 carried only £0.7m of book value. So the £452.3m United printed no longer included him, and taking off his £29.2m removed him a second time; the profit this reconstruction gives for his sale, about £8.4m (the accounts give no figure per player), is inside the £46.9m filed for 2025/26 and was also counted again in 2026/27. The 2026/27 charge for transfer fees is £182.3m, from £172.9m; the three-year average of sale profit is £36.5m, from £39.3m; squad costs are £455.9m, from £446.5m; before profit on player sales the ratio is 61.9%, from 60.6%; the room under the rule is about £201m, from about £213m. The book value United printed is £17.2m, or 3.8%, above the September model’s projection for the men’s squad, a comparison across different perimeters, where the article said the model ran £12.0m, or 2.8%, high, and the 2025/26 results move the estimate 2.1 points up, from 0.7. The update is now 0.3 points above the forecast of record, where it was 1.1 below, and the article no longer presents the closeness as a sign of an accurate forecast: the move to the group’s accounts took off 1.7 points, and like for like the results added 2.1. The range no longer allows for the £5.2m of loss-of-office costs in United’s 2025/26 accounts: they are an expense of 2025/26, not a squad cost of 2026/27, the season this test measures. Also corrected. The lenders’ minimum earnings are measured before amortisation and exceptional items as well, and without the lease accounting of IFRS 16; the £216.4m is our reconstruction from the accounts, not the lenders’ tested figure. The difference between the two wage routes is described as what it is, between two estimates, while United’s staff costs fell in 2025/26. The section that repeated the bridge in summary is removed. The waterfall chart and the cover are redrawn.