
Analysis
Chelsea have to keep selling players. Manchester City barely need to
Manchester City have been found guilty of the Premier League's financial charges and have appealed. Chelsea reported their former owner's undisclosed payments themselves, admitted them and paid. Both clubs were built on an owner's fortune, and both now play under a Premier League spending rule that gives the money those owners put in no value at all. What counts is what a club earns and what it makes selling players. Both clubs sold heavily this summer. On our central figure Manchester City are on the limit before any of those sales are counted, 1.4 percentage points over it, a margin too small to tell reliably which side they are on. Chelsea need all of theirs, and more.
Figures as of 31 October 2026, Orange Engine release V2CI · Latest figures · What the engine does not capture
Latest change to the figures, 28 October 2026: Chelsea's ratio is 88.6%, from 88.3%, and the comparison table now carries this release's figures throughout. All 16 correction notes are at the end.
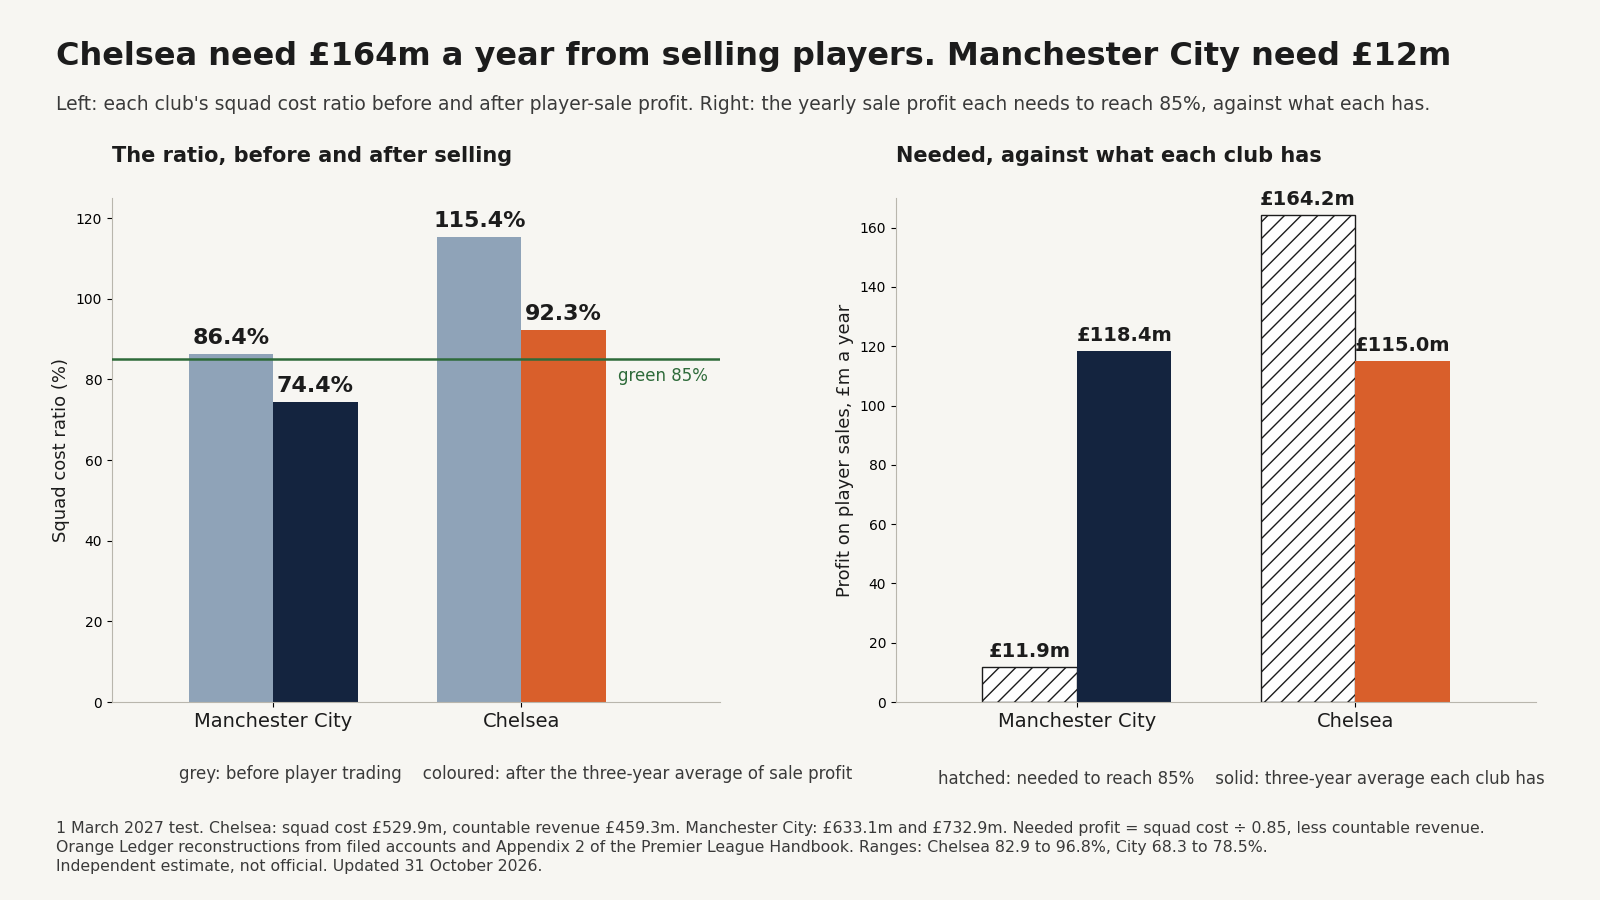
The title rests on a central model estimate, not a certainty. Before any sale is counted, City’s squad costs 86.4% of the revenue the rule counts: 1.4 percentage points above the 85% line, which is smaller than the uncertainty in our estimate of last season’s commercial revenue. On that central figure City need about £12m a year from selling players to stay inside the line; on revenue about £12m higher they would need nothing. Chelsea need £164.2m a year.
This piece started with an argument on X. A Chelsea supporter told me that the £1.39bn of debt sitting in the companies above his club had nothing to do with Chelsea, because they keep separate books, and that with Clearlake now holding more of the club there would be more money to spend on players. He is not alone in thinking that, and he is right that the debt is not in the club’s own accounts. The rest of it is where this article goes.
On 25 September The Athletic reported that the independent commission hearing the Premier League’s case against Manchester City had found 114 of the 115 charges proven. The case has run since February 2023, its charges reach back to 2009, and City, who deny any wrongdoing, are expected to appeal once the decision is published.
Six months earlier Chelsea settled with the same league over £47.5m of payments made during Roman Abramovich’s ownership and never disclosed, and in July they accepted a £10m penalty from the Football Association on 74 charges arising from the same era. Those cases reached the regulators by a different route: Chelsea’s new owners found the problems in due diligence in 2022 and reported them themselves.
Both cases go back to the years when an owner’s money was turning a club into a champion, Chelsea from 2003 and City from 2008. Both concern the two numbers the Premier League now uses to limit squad spending: what a squad costs and what a club earns. And under the squad cost ratio, the money that built both clubs counts for nothing at all.
What the rule measures, and what it ignores
The rule is simple in principle. Add up what the squad costs each year: the players’ wages, the agents’ fees, and a slice of every transfer fee, because a £60m signing on a five-year contract is charged at £12m a year rather than all at once. Then compare that with what the club earns from football, plus its profit from selling players in the last six transfer windows, about three years, divided by three. If the squad costs more than 85% of that, the club is over the line and the League examines its actual figures. At 115%, sanctions begin.
An owner who wants to put money into a club has three routes, and each lands in a different place.
- A loan. The club gets cash and owes it back. The money can pay transfer fees and wages, but it is not income, so it does nothing to raise the limit those costs are measured against.
- Shares. The owner buys new shares in the club. Nothing is owed back, but again it is not income, and the limit does not move.
- Income. The money arrives as revenue, typically sponsorship or other commercial deals. This is the only route that counts, and it counts in full, although where the sponsor is connected to the owner the League first checks that the deal is worth what is being paid.
The rules in force while Chelsea and City were being built, UEFA’s break-even requirement and then the Premier League’s profitability and sustainability rules, measured losses, and an owner could cover part of a club’s permitted losses with secure funding. What mattered was the size of the loss. Under the new rule, a £1bn loan or share issue leaves what a club may spend on its squad exactly where it was. Only income and profit from selling players move it.
That is why the two clubs now sit so far apart.
| 1 March 2027 test, £m unless stated | Chelsea | Manchester City |
|---|---|---|
| Squad cost | 529.9 | 633.1 |
| Countable football revenue | 459.3 | 732.9 |
| of which from league position and European football | 30.1 | 147.1 |
| Three-year average of player-sale profit | 139.2 | 118.4 |
| SCR before player trading | 115.4% | 86.4% |
| Squad cost ratio | 92.3% | 74.4% |
City’s squad costs £103.2m a year more than Chelsea’s, and their ratio is 17.9 percentage points lower. The whole difference comes from the revenue side: City count £273.7m more. The third row is the part of that revenue that depends on where a club finished and whether it plays in Europe: Premier League prize money that rises with league position, UEFA money for European competition, and the extra home gates European matches bring.
Those figures are my own, and they took some getting. I rebuilt the ratio for every Premier League club from the accounts filed at Companies House, player by player, and checked each squad against the Premier League’s own registration lists. Chelsea were the hardest. An early version was missing nine senior players, Moisés Caicedo and Wesley Fofana among them. An audit of contracts found three new deals the reconstruction had not carried, and a rebuild of every departure since June 2025 added thirteen missing sales and corrected two fees. Then, on 26 September, I found ten registrations being written down twice, once inside the book value in the filed accounts and once individually, and correcting that moved Chelsea’s ratio from 101.5% to 87.6%. Every correction is logged on the club’s page, and The Orange Engine sets out how the checks work.
Chelsea: loans that paid for a squad
Abramovich funded Chelsea almost entirely by lending. Chelsea’s accounts for 2016/17 put his investment since 2003 at £1.17bn, all of it in loans, and the figure was reported at more than £1.5bn by the time of the sale in 2022. The loans did not travel with the club. They sat with Fordstam, the holding company he owned Chelsea through, whose accounts still show about £1.4bn owed to Camberley International Investments, a Jersey vehicle of his, while the £2.5bn of sale proceeds remain frozen.
What the money bought was twenty years of transfer fees and wages, which are costs. The trophies helped build the commercial and sporting profile Chelsea still trade on, but the funding itself never became revenue of the kind the current rule counts. In the year to 30 June 2025 Chelsea’s commercial income was £200.9m.
I watched this happen from the north side of London. I became an Arsenal supporter first through the Dutch connection, Bergkamp and Overmars, and later through the way the team played. Abramovich arrived in the summer of 2003, the season Arsenal went unbeaten, and Chelsea won the next two titles. In May 2005 Arsène Wenger called them a financially doped club. Arsenal were by then building a new stadium on borrowed money, and the sponsorship deals signed to secure that financing tied up the club’s commercial income for years afterwards. The stadium needed them, and they held Arsenal back. Wenger kept the club in the Champions League while selling Fàbregas, Van Persie and Nasri to balance the books, and the move of Ca$$$hley Cole to Chelsea in 2006 still hurts. One club was spending owner’s money on a squad, and the other was building revenue the slow way. Today Arsenal’s squad costs £479.8m against £738.2m of the revenue the rule counts. That is what the slow way built.
Some of the owner’s money also went where the accounts did not show it. The Premier League established that between 2011 and 2018, undisclosed payments by third parties associated with the club, totalling £47.5m, were made to players, unregistered agents and others, and that they should have been treated as made by the club itself. The published sanction agreement ties more than £23m of them to the signings of five players including Eden Hazard, and more than £19m to the moves of Willian and Samuel Eto’o from Anzhi Makhachkala in 2013. The FA’s 74 charges, under its agents, intermediaries and third-party investment regulations, came mainly from the seasons 2010/11 to 2015/16. UEFA had already fined the club €10m in 2023 for incomplete financial reporting.
The new owners handled it by disclosure. The League cited Chelsea’s “proactive self-reporting, admissions of breach and exceptional cooperation” as mitigation, fined the club £10.75m across two processes, with a nine-month ban on signing academy players and a suspended one-year first-team transfer ban, and found that even with the payments included in its historical submissions Chelsea would not have breached the profitability and sustainability rules. The FA penalty was financial, with a suspended two-window registration ban. Our Chelsea reconstruction sets out all four proceedings.
Manchester City: equity, and a commercial base
Sheikh Mansour’s route was different. City’s accounts for 2017/18 stated that he had invested more than £1.3bn in the club directly, in return for new shares rather than as loans. Over the same years City built commercial income, first on sponsorship from Etihad and other Abu Dhabi and UAE partners, and later more widely.
In the year to 30 June 2025 City’s commercial income was £340.4m, and the club states it would be £61.8m higher if its retail operations were run in-house. That base is what the ratio counts today.
It is also where the Premier League’s case began. The League charged City in February 2023 with breaches over the seasons from 2009/10 to 2017/18 concerning the provision of accurate financial information, “in particular with respect to its revenue (including sponsorship revenue), its related parties and its operating costs”. The charges also alleged that managerial remuneration was not fully disclosed in the four seasons from 2009/10, alleged breaches of UEFA’s financial rules and the League’s profitability rules, and included charges of failing to cooperate with the investigation, counted as 35 when the case was brought and grouped by the commission into four, three of which it upheld.
As of 27 September the League has not published the commission’s decision, and no sanction has been set. Under its rules the award is published, and City then have 14 days to appeal. They have denied the charges throughout, and their chairman said on 26 September that the process still has a long way to run.
Where the £273.7m comes from
The revenue gap between the two clubs has two parts, with different causes.
- £117.0m comes from league position and Europe. City finished second and are in the Champions League, which is worth £147.1m to them in this calculation. Chelsea finished tenth and are out of Europe, which is worth £30.1m, all of it from league position.
- £156.6m is revenue City earn and Chelsea do not. Most of it is commercial: £340.4m against £200.9m in the last filed year, and the rule counts merchandise at gross profit, which takes £19.2m off Chelsea’s commercial revenue for the test and nothing off City’s, whose shops are run by a partner.
It is not the gate. City’s filed matchday income for 2024/25 was £75.1m, and Chelsea’s gate for this test is £82.1m: last season’s estimated receipts per home match, over the 24 home matches the rule counts this season. Stamford Bridge holds about 40,000 and Chelsea’s stadium decision is still pending, while City’s expanded North Stand takes the Etihad from 53,400 to more than 60,000 from this season, so that difference is likely to open up. It has not yet.
The £156.6m of earned revenue is more than the £115.0m a year of averaged player-sale profit and manager compensation that Chelsea rely on. Add that £156.6m to Chelsea’s revenue and, before any player trading, Chelsea’s ratio would be 86.0%, against City’s 86.4%, 0.3 percentage points apart. Chelsea’s trading profit does most, but not all, of the work that City’s larger commercial base does.
What the rule does about either kind of case
The rule compares two things, what the squad costs and what the club earns, and the two cases sit on opposite sides of that comparison. Payments to players and agents are part of what a squad costs. Kept outside the accounts, they make the squad look cheaper than it was, which is what Chelsea admitted for the Abramovich years. Earnings are the other side, and the accuracy of City’s reporting of revenue, including sponsorship, is what the League’s principal charges concerned.
A ratio is only as reliable as the two numbers in it, and the new rule is built with that in mind. Income from parties associated with a club’s owner is tested against fair market value before it counts. And a club over the 85% line has its actual figures for the season checked, not just the estimate it submitted in March.
My own view is that the rule is right to ignore owner money, even though it is hard on clubs that never had a benefactor to build their revenue for them. Owner money that arrives as a loan or as shares can stop whenever the owner decides, and a club that has built its squad on it has nothing to fall back on when it does. Revenue a club earns for itself does not leave with a change of owner. The harder question is the one the City case raises: a rule that counts revenue is only as fair as the checks on where that revenue comes from, which is why the published decision matters well beyond one club.
The Orange Ledger’s City figures rest on revenue in the filed accounts for the year to 30 June 2025, outside the period of the charges, and this piece takes no view on that revenue beyond what the accounts report. The point is structural. A revenue-based rule counts the revenue a club reports now, however the base behind it was built. The money Abramovich put into Chelsea plays no part in today’s calculation, while City’s commercial income does. What follows from the case for sanctions, for claims by other clubs or for the rules themselves depends on the published award and on any appeal.
Chelsea now: an owner whose money does not count either
Clearlake has agreed to buy out Todd Boehly and Mark Walter and take full control of Chelsea. That changes who owns the club without changing the arithmetic. The reported £950m is being paid to Boehly and Walter for their shares, and none of it reaches the club, as our analysis of the transaction sets out. Any equity Clearlake puts into Chelsea from here counts for nothing in the ratio, as Abramovich’s loans would have counted for nothing had the rule existed while he was lending.
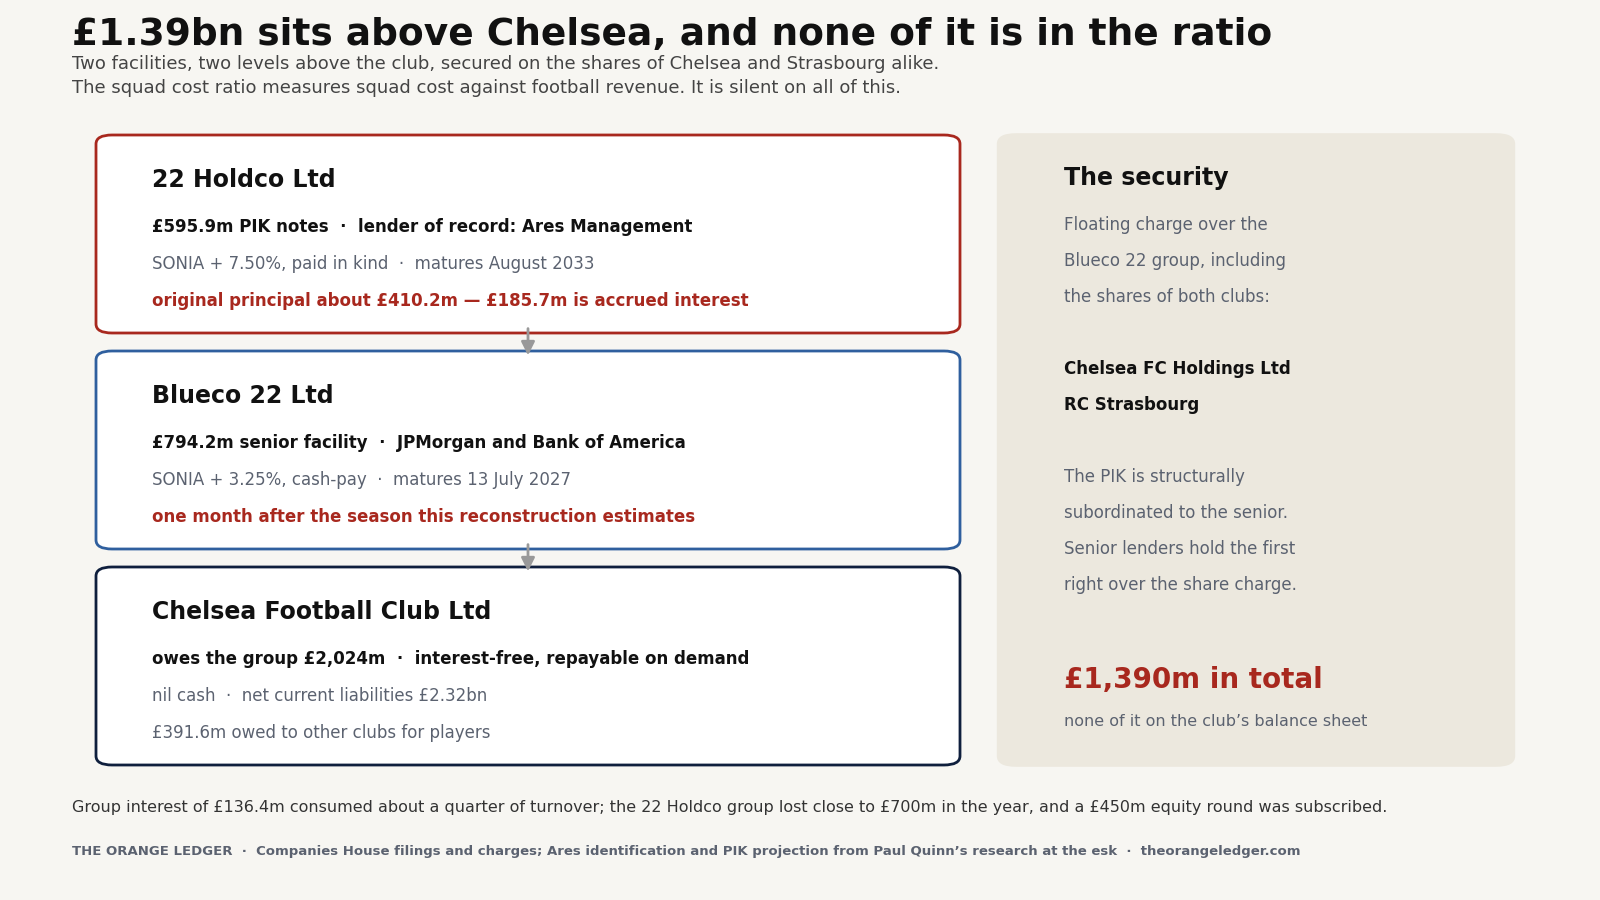
What has changed is the nature of the owner. Clearlake’s investment was led by one of its funds on behalf of affiliated funds and other partners, which means institutional capital that expects a return. Separately, the companies between Clearlake and the club, Blueco 22 Ltd and 22 Holdco Ltd, carry £1.39bn of external debt, and the £794.2m senior facility at Blueco 22 matures in July 2027. Abramovich covered Chelsea’s losses for nineteen years. A fund manager’s investors expect their money back with a return.
The trading that holds Chelsea near the line
That leaves Chelsea’s permitted spending resting on two things: revenue, and profit on selling players.
| Chelsea’s player-sale profit and manager compensation | £m |
|---|---|
| February to June 2024 | 73.8 |
| 2024/25 | 57.9 |
| 2025/26 | 98.7 |
| 2026/27 to date | 170.2 |
| Compensation from City for releasing Maresca, June 2026 | 17.0 |
| Three-year average | 115.0 |
The rule adds up the profit of the six most recent transfer windows and divides it by three (Rules A.1.13 and A.1.53), so a strong window counts in three successive tests and a weak one does not sink a single season. Chelsea do not have to produce £115m of profit every year, but they have to produce it over time, because every profitable year eventually rolls out of the average and has to be replaced. Holding squad cost and revenue where they are, with no further sales, the ratio would move from 92.3% to 98.6% at the 2028 test, 99.8% in 2029 and 115.4% in 2030. The 115% line applies to the ratio after sale profit, 92.3% now; by 2030, with no sale profit left in the average, the ratio would sit 0.1 points above it. Revenue is held at this season’s figures in that arithmetic; next season’s commercial revenue is not forecast.
Every £10m less of average annual sale profit adds about 1.5 percentage points to Chelsea’s ratio, because it comes straight out of the denominator: at £129.2m, the same squad cost gives 93.9%.
Profit here is the fee less the player’s remaining book value, which is why academy graduates, carried at almost nothing, contribute nearly their whole fee, while a player bought recently for a large sum contributes much less. The largest single contribution to the current pool is Enzo Fernández’s £125m move to Manchester City, which produced about £49m of profit: the fee less a carrying value of about £74m, less 5% for the costs of the sale, roughly an eighth of the pool the average is taken over. Part of the profit supporting Chelsea’s ratio this season was paid by the club on the other side of this comparison.
Accounting profit is not cash, either. Transfer fees are usually paid in instalments, and Chelsea’s own accounts show £391.6m owed to other clubs for players at 30 June 2025, £197.8m of it due within a year. A sale does its full work in the ratio in the season it is made while the money can arrive over three or four years.
Both clubs sold heavily. Only one needs to keep doing it
Manchester City sold heavily this summer too. Sixteen registrations left in 2026, and City’s profit on player sales this season stands at £145.8m, against Chelsea’s £170.2m. The difference is what the selling is for.
Before any sales, City’s squad costs 86.4% of the revenue the rule counts, 1.4 percentage points above the 85% line, a margin too small for the estimate to tell which side City are on before a sale is counted. On that central figure the sale profit City need to reach 85% is about £12m a year, and their £118.4m average covers it many times over. Before any sales, Chelsea’s squad costs 115.4%, and their £115.0m average is what brings them down to 92.3%, which is still above the line. City could sell far less and stay inside the limit. Chelsea would need to sell more, or earn more, to get inside it at all: on the present cost and revenue, about £164m a year of sale profit would bring them to 85%, against the £133.5m they have.
City’s comfort rests on one condition. £147.1m of the revenue counted for them depends on finishing near the top of the league and playing in Europe. Without it, the same squad would cost 107.1% of their revenue before any sales, about eight percentage points below Chelsea’s 115.4%. So City can sell far less than they do for as long as they keep finishing high and qualifying for Europe. A league-points deduction or a European ban, if either were ever imposed, would reach exactly that part of their revenue.
Why Chelsea fans expect more, and why the numbers disagree
For twenty years a Chelsea supporter could assume that any player was within reach. Abramovich would fund him, and the rules of the day allowed it as long as the owner covered the losses. Manchester City then arrived as bigger spenders still, and they put money into the squad and into revenue at the same time, although how some of that revenue was accounted for is exactly what the Premier League case disputes.
Now the ownership has narrowed. Clearlake is buying out Boehly and Walter, leaving Hansjörg Wyss as the one other shareholder, and to many fans that looks like the Abramovich model returning: one decisive owner, deep pockets, more new players.
I think that expectation runs into four things at once.
- The rule. Chelsea’s squad already costs 115.4% of the revenue the rule counts before any sales, and owner money cannot change that.
- The stadium. Stamford Bridge holds about 40,000, and there is still no decision on a new ground.
- The revenue. Commercial income of £200.9m against Manchester City’s £340.4m, and no European football this season.
- The cost of money. The £794.2m senior loan above the club is charged at 3.25 percentage points over SONIA, the sterling benchmark rate that follows the Bank of England’s, and falls due in July 2027. The £595.9m of notes above that is charged at 7.5 percentage points over the same rate, and the interest is not paid in cash but added to the debt. Group interest came to £136.4m in 2024/25, about a quarter of the group’s turnover.
The debt is outside the club’s own accounts, but it is not outside its reality. It has to be serviced or refinanced from a business whose squad stays near the line only because it makes about £139m a year of profit selling players. Keeping that going while also buying the next wave of expensive signings looks extremely difficult to me, because every new signing adds to the squad’s cost, while the sales needed to make room for it must also produce an accounting profit.
What this doesn’t say
- That Manchester City’s current revenue is misstated. The figures used here come from City’s accounts for the year to 30 June 2025, outside the period of the charges, and nothing in this piece questions them.
- Anything about the outcome of the case. The commission’s decision was published on 29 September; City appealed on 2 October (Premier League statement of that day); an Appeal Board hears the appeal in private, and no sanction has been set.
- That the two cases are equivalent. Chelsea’s concerned undisclosed payments that the club admitted; City’s charges were broader, concerned revenue as well as costs, and are denied.
- That Chelsea cannot spend. They can, within what their revenue and their player trading support, and Clearlake can fund whatever the club spends.
- That the squad cost ratio measures financial health. Chelsea’s £1.39bn of external debt above the club, and the interest on it, sit entirely outside it.
What it does say
- Under the squad cost ratio, owner loans and owner equity enlarge nothing. Only revenue and player-sale profit raise what a club may spend on its squad.
- City’s squad costs £103.2m more than Chelsea’s and their ratio is 17.9 percentage points lower, because City count £273.7m more revenue: £117.0m from league position and Europe, and £156.6m earned, most of it commercial.
- That £156.6m is more than the £115.0m a year of averaged player-sale profit and manager compensation that brings Chelsea from 115.4% to 92.3%.
- Each £10m less of that average adds about 1.5 percentage points, and on unchanged costs and revenue the current pool has rolled out entirely by the 2030 test.
- On the central figure Manchester City need about £12m a year of sale profit to reach 85%, against a £118.4m average: before any sale they are 1.4 percentage points above the line, too small a margin to tell reliably which side they are on, and that holds only as long as the £147.1m that comes from league position and Europe does.
Chelsea helped create the era of the owner who covered the losses. Twenty years on, the clubs best placed under the rule are the ones that built recurring revenue the slow way. Liverpool own their stadium, make a profit and sit at 73.6% on my figures. Arsenal borrowed to build theirs and paid for it themselves. The question for Chelsea, and for the fan who started this argument, is whether financial prudence finally wins. If it does, Arsène Wenger may yet get his final revenge.
Sources and caveats.
The accounts. Chelsea Football Club Ltd and Chelsea FC Holdings Ltd, and Manchester City Football Club Limited, accounts for the year to 30 June 2025, filed at Companies House. External debt above Chelsea from the Blueco 22 Ltd and 22 Holdco Ltd accounts for the same year. Squad cost ratio figures are Orange Ledger estimates for the 1 March 2027 test, set out in full with their ranges in the Chelsea reconstruction (range 79.7 to 96.8%) and the Manchester City reconstruction (range 68.3 to 78.5%).
Owner funding. Abramovich's investment of £1.17bn in loans is as stated in Chelsea's 2016/17 accounts, and Mansour's direct investment of more than £1.3bn for new shares as stated in City's 2017/18 accounts, both as reported by the Irish Times in September 2018. The £1.5bn figure at the 2022 sale is as reported at the time. The £1.4bn owed by Fordstam to Camberley International Investments is as reported from Fordstam's accounts in September 2026.
The rules applied. Premier League Handbook 2026/27, Appendix 2. The split of revenue between what comes from league position and European football and what a club earns otherwise follows the two reconstructions: the merit payment above the fifteenth-place floor, the European distribution under Rule A.1.29(e) and the European home gate.
What is estimated. Both clubs' player wages are estimates, because neither discloses a players' wage bill. Players signed since each club's last accounts are counted at the reported fee plus 12%, for the League's 4% transfer levy, agents' fees and the other costs of a transfer. Both clubs' commercial figures for the test are estimates for 2025/26, whose accounts are not yet filed, from one published method (how we estimate last season's commercial revenue): the figure filed for 2024/25, grown by the rate the method gives a commercial income of that size, 9.2% for Chelsea and 6.9% for City, with £3.7m added to City's for the women's team. Chelsea's is then less the cost of the merchandise sold: £19.2m, the merchandise's share by sales of the £23.0m cost of sales in the accounts of the club's own merchandising company. Nothing is taken off City's, whose shops are run by a partner. The gate is that season's estimated receipts per home match over the 24 home matches the rule counts. The comparisons of commercial and matchday income use each club's filed 2024/25 figures, except Chelsea's gate, which is the estimate used in the test.
The Chelsea proceedings. UEFA's €10m settlement of July 2023; the Premier League settlement announced on 16 March 2026 on £47.5m of undisclosed payments between 2011 and 2018, with the League's statement on mitigation and on the profitability and sustainability rules, and the published sanction agreement for the transfers named; and the FA's 74 charges of September 2025, concluded on 31 July 2026. All arose from matters self-reported by the club's current owners.
The Premier League case against Manchester City. The charges and their period are as announced by the Premier League on 6 February 2023. The reported finding on 114 of 115 charges is attributed to The Athletic, Reuters and the Financial Times; the decision was unpublished at the time of writing, no sanction had been set, and the club denies wrongdoing. Nothing here asserts that any party acted improperly beyond what has been admitted, found and published, or reported, and this publication takes no view on the case.
Methodology. The Orange Engine sets out the population checks, transaction reconciliation, uncertainty ranges and cross-club controls behind these estimates.
Independent estimate, not an official calculation, and not advice. Figures as signed on 26 September 2026; updated 5 October, 7 October, 9 October and 23 October 2026.
Corrections and updates (17)
29 September 2026 · New evidence · several figures: see the note
Update, 29 September 2026. The Premier League has now published the independent commission's core decision. It found Manchester City guilty of all the charges relating to breaches of the League's financial rules between 2009/10 and 2017/18, including 'sham' commercial contracts, part of a disguised funding scheme paid for by the club's owner, that inflated revenue and reduced costs by more than £900m, and upheld three of the four charges that City failed to cooperate. No sanction has been set. City say the decision contains material errors of law, principle and fact and will appeal. The references below to the decision being unpublished were correct when this piece was written on 27 September. The Orange Ledger's figures use City's accounts for 2024/25, outside the period of the charges, and are unchanged.
1 October 2026 · Data correction · several figures: see the note
Update, 1 October 2026. Both clubs' figures now take agents' fees from the FA's published figures rather than estimates. Chelsea's ratio is 88.4%, from 87.6%, and Manchester City's 74.2%, from 75.4%, so the gap between them widens. Chelsea would need about £146m a year of sale profit to reach 85%, from £141m, and City about £11m, from £23m. One comparison is less close than it was: adding City's £122.8m of earned revenue to Chelsea's now gives 88.3% against City's 86.3%, where it had given 87.5% against 87.7%. The argument is unchanged. The account below of the 26 September correction, from 101.5% to 87.6%, is left as it happened.
1 October 2026 (evening) · Data correction · several figures: see the note
Update, 1 October 2026, evening. Manchester City's squad cost is now £612.1m, from £611.9m, after Enzo Fernández's fee was taken at £125m on both sides of his transfer from Chelsea. City now need about £11.1m a year of sale profit to reach 85%, and without the revenue that depends on league position and Europe their squad would cost 107.7% of revenue before sales. Both clubs' ratios are unchanged.
2 October 2026 · Data correction · several figures: see the note
Update, 2 October 2026. Both clubs' figures are updated to their corrected reconstructions. Chelsea's ratio is 88.6%, from 88.4%, and 111.3% before player trading, from 111.1%; Manchester City's is 74.1%, from 74.2%, and 86.2% before player trading, from 86.3%. City now need about £10m a year of sale profit to reach 85%, against a £115.0m average, and Chelsea about £147m against £122.0m, so the gap between them widens again. City's lower figures come mainly from contract extensions now recorded for Ederson and John Stones and from Savinho's five-year term, which together lower City's amortisation by about £1.1m; Chelsea's come from corrected fees and dates. Adding City's £122.8m of earned revenue to Chelsea's now gives 88.5% against City's 86.2%. Three older figures are also brought up to date: Arsenal's squad cost is £462.2m, not £470.5m; Enzo Fernández's carrying value at sale is about £66m, which gives about £56m of profit; and Liverpool's ratio is 70.6%, not 71.2%. The argument is unchanged.
3 October 2026 · Data correction · several figures: see the note
Update, 3 October 2026. Chelsea's ratio is now 88.0%, from 88.6%, and 110.3% before player trading, from 111.3%; Manchester City's is now 74.2%, from 74.1%, and 86.3% before player trading, from 86.2%, after home matches were counted from match reports and last season's matchday receipts were re-estimated (How we estimate matchday revenue). The revenue the rule counts is now £480.2m for Chelsea, from £475.9m, and £708.3m for City, from £709.0m, so City count £228.2m more than Chelsea, from £233.1m: £109.8m from league position and Europe, from £110.3m, and £118.3m earned, from £122.8m. Chelsea's gate for the test is now £82.1m, from £77.8m. Chelsea now need about £143m a year of sale profit to reach 85%, from about £147m; City still need about £10m. The gap between the two ratios is now 13.8 points, from 14.5. Two other clubs' figures are also updated: the revenue the rule counts for Arsenal is now £764.1m, from £775.8m, and Liverpool's ratio is now 69.6%, from 70.6%. A separate review of agents' fees on signings since the last accounts is under way and may raise this figure; we will report its result.
4 October 2026 · Methodology change · several figures: see the note
Correction, 4 October 2026. Chelsea's ratio is now 94.0%, from 88.0%, and 116.4% before player trading, from 110.3%; Manchester City's is now 76.1%, from 74.2%, and 88.1% before player trading, from 86.3%, after registrations were counted at the reported fee plus 12% and merchandise at gross profit, and cup prize money was rebuilt from each club's cup ties (Three definitions in the squad cost rule, and what they change). Chelsea now need about £168m a year of sale profit to reach 85%, from about £143m, against a three-year average that is now £108.3m, from £122.0m; City now need about £25m, from about £10m, against £110.3m, from £115.0m. Squad cost is now £529.3m for Chelsea, from £529.8m, and £619.2m for City, from £611.0m, so City's squad costs £89.9m more, from £81.1m. The revenue the rule counts is now £454.9m for Chelsea, from £480.2m, because £19.2m of merchandise cost is taken off its commercial revenue and its cup income is £6.1m lower; City's is now £703.1m, from £708.3m, on cup income £5.2m lower, so City count £248.3m more than Chelsea, from £228.2m, of which £138.4m is earned, from £118.3m. The gap between the two ratios is now 17.9 points, from 13.8. One comparison no longer holds: City's extra earned revenue was close to Chelsea's averaged sale profit and is now £30.1m more than it; adding it to Chelsea's revenue gives 89.2% before player trading against City's 88.1%, from 88.5% against 86.3%. Chelsea's sale profit is now £96.3m for 2025/26, from £120.3m, and £170.6m for this season, from £187.8m; City's for this season is £145.2m, from £157.9m. Enzo Fernández's carrying value at sale is now about £74m, from about £66m, which gives about £49m of profit, from about £56m. Each £10m less of Chelsea's average now adds about 1.7 points, from about 1.5; with no further sales the ratio would run 97.3%, 103.4% and 116.4% at the next three tests, from 90.9%, 97.6% and 110.3%; and without the revenue that depends on league position and Europe City's squad would cost 109.9% of revenue before sales, from 107.5%. The ranges are now 89.6 to 98.8% for Chelsea, from 83.8 to 92.4%, and 71.6 to 80.6% for City, from 69.9 to 78.7%. Two other clubs' figures are also updated: Arsenal's squad cost is now £470.7m, from £462.2m, against £727.7m of the revenue the rule counts, from £764.1m, and Liverpool's ratio is now 73.9%, from 69.6%.
5 October 2026 · Methodology change · several figures: see the note
Update, 5 October 2026. Chelsea's ratio is now 94.3%, from 94.0%, and 116.8% before player trading, from 116.4%, after contract lengths were measured from their dates (the engine changelog). Manchester City's ratio is unchanged at 76.1%, and 88.0% before player trading, from 88.1%: the same change raised it, and the women's team's ticket and broadcasting revenue, which is now counted, lowered it. Squad cost is now £531.5m for Chelsea, from £529.3m, and £621.9m for City, from £619.2m, so City's squad costs £90.4m more, from £89.9m. City's countable revenue is now £706.8m, from £703.1m, so City count £251.9m more than Chelsea, from £248.3m, of which £142.1m is earned, from £138.4m. Chelsea now need about £170m a year of sale profit to reach 85%, from about £168m, against a three-year average that is now £108.9m, from £108.3m; City still need about £25m, against £110.7m, from £110.3m. Chelsea's sale profit is now £98.7m for 2025/26, from £96.3m, and £170.2m for this season, from £170.6m; City's for this season is £145.8m, from £145.2m. Adding City's extra earned revenue to Chelsea's now gives 89.0% before player trading against City's 88.0%, from 89.2% against 88.1%. With £10m less of Chelsea's average the ratio would be 96.0%, from 95.7%; with no further sales it would run 97.6%, 103.9% and 116.8% at the next three tests, from 97.3%, 103.4% and 116.4%; and without the revenue that depends on league position and Europe City's squad would cost 109.7% of revenue before sales, from 109.9%. The ranges are now 89.9 to 99.1% for Chelsea, from 89.6 to 98.8%, and 71.6 to 80.5% for City, from 71.6 to 80.6%. Two other clubs' figures are also updated: Arsenal's squad cost is now £473.8m, from £470.7m, and Liverpool's ratio is now 74.0%, from 73.9%. The gap between the two ratios is now 18.2 points, from 17.9.
7 October 2026 · New evidence · several figures: see the note
Update, 7 October 2026. Chelsea's ratio is now 93.2%, from 94.3%, and 115.5% before player trading, from 116.8%, after the fee for Axel Disasi's loan to Crystal Palace, an estimate of £6.0m, was counted as received and set against the cost of his registration (the engine changelog). Manchester City's ratio is now 75.7%, from 76.1%, and 87.5% before player trading, from 88.0%, after the three-year average of UEFA prize money was rebuilt from its three seasons, £84.4m where we had used £80.0m, and Elliot Anderson's signing was dated 23 July 2026. Squad cost is now £525.5m for Chelsea, from £531.5m, and £622.2m for City, from £621.9m, so City's squad costs £96.7m more, from £90.4m. Chelsea's three-year average of sale profit is unchanged at £108.9m; they now need about £163m a year to reach 85%, from about £170m. City now need about £21m, from about £25m, against £110.7m. City's countable revenue is now £711.3m, from £706.8m, so City count £256.4m more than Chelsea, from £251.9m, of which £114.2m comes from league position and Europe, from £109.8m; the £142.1m that is earned is unchanged. The heading above that split had still read £248.3m, the figure of 4 October, and now gives £256.4m. Adding City's extra earned revenue to Chelsea's now gives 88.0% before player trading against City's 87.5%, from 89.0% against 88.0%. With £10m less of Chelsea's average the ratio would be 94.9%, from 96.0%; with no further sales it would run 96.5%, 102.7% and 115.5% at the next three tests, from 97.6%, 103.9% and 116.8%; and without the revenue that depends on league position and Europe City's squad would cost 109.8% of revenue before sales, from 109.7%, about six points below where Chelsea are, from about seven. The ranges are now 88.9 to 98.0% for Chelsea, from 89.9 to 99.1%, and 71.2 to 80.1% for City, from 71.6 to 80.5%. The gap between the two ratios is now 17.5 points, from 18.2.
7 October 2026 (second) · Data correction · several figures: see the note
Update, 7 October 2026, second correction of the day. Manchester City's ratio is now 75.4%, from 75.7%, and 87.1% before player trading, from 87.5%, after the home gate was counted for five European home matches, where we had counted four: the rule takes the higher of the home matches a club is guaranteed this season and the average it played at home in the same competition over the last three seasons, rounded up, and we had applied only the first (how we count matchday revenue). Chelsea's figures are unchanged. City's countable revenue is now £714.0m, from £711.3m, so City count £259.1m more than Chelsea, from £256.4m, of which £117.0m comes from league position and Europe, from £114.2m; the £142.1m that is earned is unchanged. City now need about £18m a year of sale profit to reach 85%, from about £21m, against £110.7m. Adding City's extra earned revenue to Chelsea's still gives 88.0% before player trading, now against City's 87.1%, from 87.5%. The range is now 71.0 to 79.8% for City, from 71.2 to 80.1%. The gap between the two ratios is now 17.8 points, from 17.5. One other club's figure is also updated: the revenue the rule counts for Arsenal is now £743.8m, from £727.7m, because seven European home matches are counted for Arsenal, where we had counted four.
9 October 2026 · Methodology change · several figures: see the note
Correction, 9 October 2026. Last season's commercial revenue is now estimated by one published method, the same for every club (how we estimate last season's commercial revenue). The earlier figures for both clubs were judgements of ours and are withdrawn: Chelsea's estimate is now £219.4m, from £215.0m, and Manchester City's £367.6m, from £348.7m. Chelsea's ratio is now 92.5%, from 93.2%, and 114.4% before player trading, from 115.5%; that figure is now 0.6 percentage points below 115%, where it was 0.5 above, a margin that does not reliably tell which side of 115% it is on. Manchester City's ratio is now 73.8%, from 75.4%, and 84.9% before player trading, from 87.1%. This article said City needed about £18m a year of sale profit to reach 85%, a fraction of what they sell. It now says that on the central figure City need about nil: before any sale is counted City are 0.1 percentage points inside the 85% line, because their squad cost divided by 0.85 is £0.9m less than the revenue the rule counts. That margin is far smaller than the estimate's error, and the figure does not reliably tell which side of the line City are on before a sale is counted. Chelsea now need about £159m a year, from about £163m, against £108.9m. The revenue the rule counts is now £459.3m for Chelsea, from £454.9m, and £732.9m for City, from £714.0m, so City count £273.7m more than Chelsea, from £259.1m, of which £156.6m is earned, from £142.1m; the £117.0m that comes from league position and Europe is unchanged. Adding City's extra earned revenue to Chelsea's now gives 85.3% before player trading against City's 84.9%, from 88.0% against 87.1%. With £10m less of Chelsea's average the ratio would be 94.1%, from 94.9%; with no further sales it would run 95.7%, 101.8% and 114.4% at the next three tests, from 96.5%, 102.7% and 115.5%; and without the revenue that depends on league position and Europe City's squad would cost 106.2% of revenue before sales, from 109.8%, about eight points below where Chelsea are, from about six. The ranges are now 86.6 to 98.6% for Chelsea, from 88.9 to 98.0%, and 69.1 to 78.9% for City, from 71.0 to 79.8%. The gap between the two ratios is now 18.7 percentage points, from 17.8. Two other clubs' figures are also updated: the revenue the rule counts for Arsenal is now £738.2m, from £743.8m, and Liverpool's ratio is now 72.9%, from 74.0%. The figures for later tests hold this season's revenue fixed and do not forecast next season's commercial revenue.
16 October 2026 · Assumption revision · several figures: see the note
Updated 16 October 2026: loans out now recorded; wage relief shown in ranges. Both clubs' central figures are unchanged: Chelsea 92.5%, Manchester City 73.8%. Every club's players out on loan are now recorded, and where nobody says how much of a loaned player's wage the borrowing club pays, the possible saving widens the assumption range rather than moving the central figure. Chelsea's range is now 83.0% to 97.2%, from 86.6% to 98.6%, and City's 67.6% to 77.9%, from 69.1% to 78.9%. The bottom of Chelsea's range is now below 85%; its central estimate is not. Liverpool's ratio is now 72.7%, from 72.9%. The chart is redrawn.
23 October 2026 · Methodology change · several figures: see the note
Correction, 23 October 2026. Both clubs' figures are restated to our corrected reconstructions, and one statement in this article is reversed: before any sale is counted, Manchester City's squad now costs 85.6% of the revenue the rule counts, 0.6 percentage points above the 85% line, where this article said 84.9%, 0.1 inside it. Either margin is smaller than the uncertainty in our estimate of last season's commercial revenue, so the estimate still cannot tell which side of the line City are on before a sale. On the central figure they now need about £5m a year of sale profit to reach 85%, where they needed about nil, against an average of £118.4m. The title stands.
Two rules had not been applied in full. Rule A.1.22(c) caps the spreading of a transfer fee at five years for any contract executed since 12 December 2023, and we had not applied the cap to registrations already in the filed book value: it adds £5.2m to City's amortisation, Erling Haaland's extension the largest part, and £3.0m to Chelsea's. Rules A.1.13 and A.1.53 average the profit on player sales over the six most recent transfer windows, which for this test begin in February 2024, where we had averaged three financial years: that brings in Chelsea's £73.8m of sales from February to June 2024 and City's £23.1m, so Chelsea's average is £133.5m, from £108.9m, and City's £118.4m, from £110.7m.
Chelsea's ratio is now 89.1%, from 92.5%, and 115.1% before player trading, from 114.4%, 0.1 of a point above the 115% at which the red line is set; they need about £162m a year of sale profit to reach 85%, from £159m. City's ratio is 73.7%, from 73.8%. City's squad costs £98.9m more than Chelsea's, from £96.7m, and their ratio is 15.4 points lower, from 18.7. With City's £156.6m of earned revenue added, Chelsea's figure before trading would be 85.8%, against City's 85.6%. On unchanged costs and revenue Chelsea's ratio would be 96.2% at the 2028 test, 100.6% in 2029 and 115.1% in 2030, and each £10m less of average sale profit adds about 1.5 points, from 1.7. The ranges are 80.2% to 93.5% for Chelsea and 67.7% to 77.8% for City. Arsenal's squad cost, quoted in passing, is £475.4m, a figure that had not been brought up to date before; it was £473.8m. A paragraph printed twice at the top of the article now appears once. The lead chart and the cover are redrawn. See the engine changelog.
24 October 2026 · Methodology change · no figure changed
Correction, 24 October 2026. No figure changed. This article said the rule averages profit on player sales over the last three years. It takes the profit or loss on sales in the six most recent transfer windows and divides it by three (Rules A.1.13 and A.1.53). Six windows cover about three years, but a club’s sales from February to the end of its financial year fall in a later window than the rest of that year, so they stay in the average for one test longer. The sentence now says six transfer windows. The figures in this article already count sales by window.
25 October 2026 · Data correction · no figure changed
Correction, 25 October 2026. No figure changed. City appealed on 2 October (Premier League statement of that day); the description and the list of what this piece does not say now record it, where they said City would appeal or were expected to. The charges of failing to cooperate were given as 35, the count when the case was brought; the commission’s decision groups them as four, three of them upheld, as the note of 29 September says, and the sentence now gives both. The profit on Enzo Fernández’s sale now shows how it is reached, the fee less his carrying value less 5% for the costs of a sale, because £125m less £74m reads as £51m. And the forward path now says that the 115% line applies to the ratio after sale profit, so that 115.1% in 2030 is read as what it is: the ratio with no sale profit left, just above the line.
26 October 2026 · Regulatory interpretation · several figures: see the note
Correction, 26 October 2026. Fees paid and received for head coaches now count, and filed loan income is in the ranges. A fee one club pays another for a head coach is part of the squad cost, spread over his contract (Rule A.1.22(d)); compensation a club receives for releasing one counts with the profit on player sales (Rule A.1.29(g)). We had counted neither. Fees received for lending players count with the profit on player sales (the guidance to Rule A.1.29(g)); the accounts do not split them from wages recharged, so they widen the range and leave the central figures alone. Manchester City’s ratio is 74.4%, from 73.7%, and 86.4% before any sale, from 85.6%, 1.4 percentage points above the 85% line, from 0.6, because the £17.2m fee City paid for Enzo Maresca counts in the squad cost; City need about £12m a year of sale profit to reach 85%, from about £5m. Chelsea’s ratio is 88.3%, from 89.1%, because the £17.0m Chelsea received for releasing him counts with the sale profit: the three-year average is £139.2m, from £133.5m, and the table of Chelsea’s sale profit now has a row for it. With no further selling Chelsea’s 2028 and 2029 tests are 95.2% and 99.5%, from 96.2% and 100.6%. Chelsea with the earned revenue added, 85.8%, are 0.6 percentage points below City’s 86.4%, where they were within a quarter of a point of City’s 85.6%. The ranges are 79.4% to 92.6% for Chelsea, from 80.2% to 93.5%, and 68.3% to 78.5% for City, from 67.7% to 77.8%. Both are reported fees, not yet in filed accounts (The Irish Times and City AM, June 2026).
28 October 2026 · Data correction · several figures: see the note
Correction, 28 October 2026. We checked every transfer in our records against published sources and corrected sixteen entries at eleven clubs where the club’s announcement or a reputable report, read on the page, gives a different fee, contract length or date. Chelsea’s ratio is 88.6%, from 88.3%, and 115.4% before any sale, from 115.1%; the range is 79.7% to 92.9%, from 79.4% to 92.6%. The comparison table had kept Chelsea’s and City’s squad costs and Chelsea’s sale-profit average from an earlier release while its ratios moved on. They are now £529.9m and £633.1m, from £528.5m and £627.4m, and £139.2m, from £133.5m, so City’s squad costs £103.2m more than Chelsea’s, from £98.9m, and their ratio is 14.2 percentage points lower, from 15.4. With City’s earned revenue added, Chelsea would be at 86.0%, 0.3 percentage points below City’s 86.4%, from 85.8% and 0.6. At £10m less of average sale profit, £129.2m, Chelsea’s ratio would be 90.1%, from 90.7% at the earlier average. The sale profit Chelsea need to stay at 85% is £164.2m, from £162.5m; with no further selling the 2028 and 2029 tests are 95.4% and 99.8%, from 95.2% and 99.5%.
31 October 2026 · Data correction · SCR 88.6% → 92.3%
Correction, 31 October 2026. Chelsea’s ratio is 92.3%, from 88.6%. Bashir Humphreys and Kepa Arrizabalaga were counted twice, in 2024/25 by the accounts and in 2025/26 by us, and summer 2025 sale profit is now anchored to note 30 of the accounts of Chelsea FC Holdings: £31.8m, where we had modelled £82.4m. The three-year average of sale profit is £115.0m, from £139.2m, the top of the range 96.8%, from 92.9%, the ratio at the 2028 test 98.6%, from 95.4%, and City’s ratio is 17.9 percentage points below Chelsea’s, from 14.2. Liverpool’s ratio is 73.6%, from 72.7%, on its own filed sale profit of £104.7m, where we had modelled £132.5m. Figures that follow from these are restated with them in the text. The correction does not reverse the article’s conclusion.