
Analysis
Chelsea at £5bn: what the price tells you, and what it doesn't
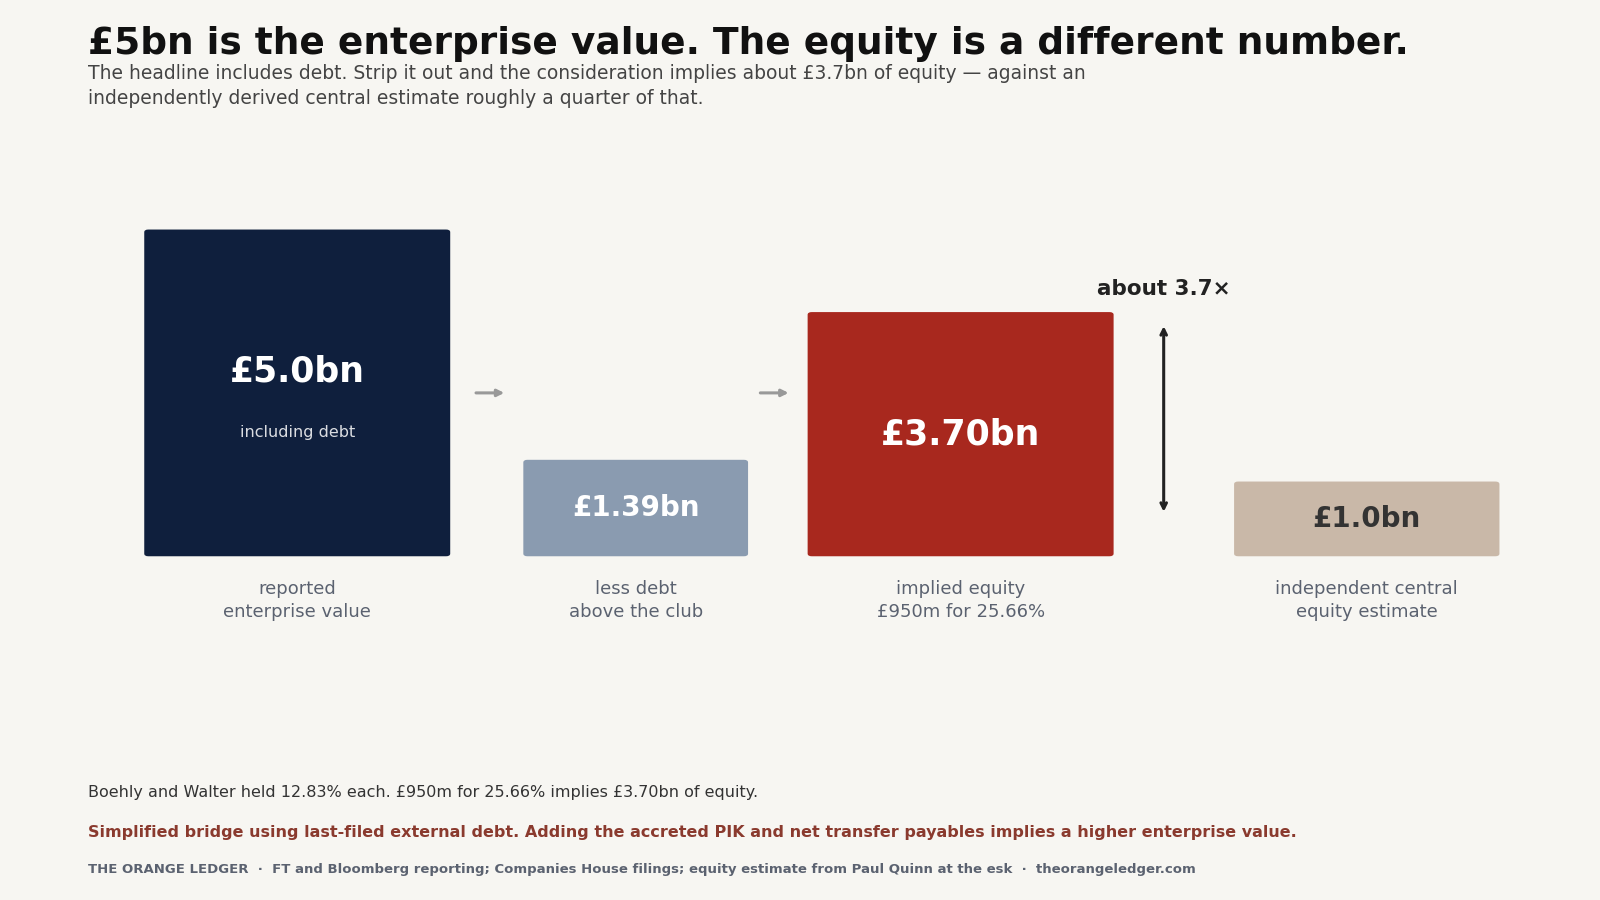
Todd Boehly and Mark Walter have agreed to sell their Chelsea stakes to Clearlake, which will take full control on completion. The Financial Times reports £950m for the two holdings and a club valuation of £5bn including debt; Bloomberg describes an enterprise value of about the same. Neither figure is an equity value. About £1.4bn of external debt sits above the football club in the ownership chain. The consideration implies equity of roughly £3.7bn, against Paul Quinn's independently derived central estimate of about £1bn. This piece sets out what was announced, why a buyer already holding 61.5% has reasons to pay a price a third party might not, and what the accounts say about the business Clearlake has taken control of: a squad costing £530m against £459m of the revenue the squad cost rule counts, an 92% regulatory ratio held there by £115m of averaged player-trading profit, and a £794m senior facility maturing in July 2027.
Figures as of 31 October 2026, Orange Engine release V2CI · Latest figures · What the engine does not capture
Latest change to the figures, 31 October 2026: Chelsea’s ratio is 92.3%, from 88.6%, because of a double count and a filed sale profit. All 17 correction notes are at the end.
Todd Boehly and Mark Walter have agreed to sell their Chelsea stakes to Clearlake Capital, which will take full control when the transaction completes.
The headline number is £5bn. It is worth understanding what that figure is measuring before deciding what it proves.
What was actually announced
Chelsea confirmed on Wednesday evening that affiliates of Clearlake will acquire Boehly’s ownership interest and, as part of the same transition, Walter’s. Boehly leaves as chairman. Hansjörg Wyss remains a stakeholder, so “full control” means control, not 100% ownership. If Clearlake alone acquires the two departing stakes its holding rises to about 87.2%; the reporting leaves open whether Wyss participates alongside it, in which case Clearlake would sit nearer 82.7% and Wyss higher. The club says there will be no change to day-to-day operations, leadership or strategy.
The ownership split before the deal:
| Stake | |
|---|---|
| Clearlake Capital | 61.5% |
| Todd Boehly | 12.83% |
| Mark Walter | 12.83% |
| Hansjörg Wyss | 12.83% |
The club did not disclose a price. The Financial Times reports £950m for the two stakes combined, in a deal valuing Chelsea at £5bn including debt, relayed by ESPN and CNBC. Bloomberg describes an enterprise value of about £5bn, sourced to people familiar with the terms, and reports the deal as agreed rather than completed. The FT expects completion by the end of 2026.
The consortium bought Chelsea from Roman Abramovich in May 2022 for £2.5bn, with a further £1.75bn committed to investment in the club.
Enterprise value is not equity value
This is the distinction the headline collapses, and it is worth four paragraphs.
Enterprise value is what the whole business is worth including its debt: what you would pay for the company plus what you would have to repay or assume. Equity value is what the shares are worth once that debt is deducted.
Chelsea’s ownership chain carries substantial debt, and none of it sits on the football club’s balance sheet. At 30 June 2025, the filings for which Quinn set out in detail in May, BlueCo 22 Ltd held a £794.2m senior facility at 3.25% over SONIA, cash-pay, maturing 13 July 2027. Above it, 22 Holdco Ltd held £595.9m of notes lent by Ares Management, at 7.50% over SONIA paid in kind, meaning the interest compounds into the balance rather than being settled each year. About £1.39bn at the last filed date, and the PIK has been accreting since.
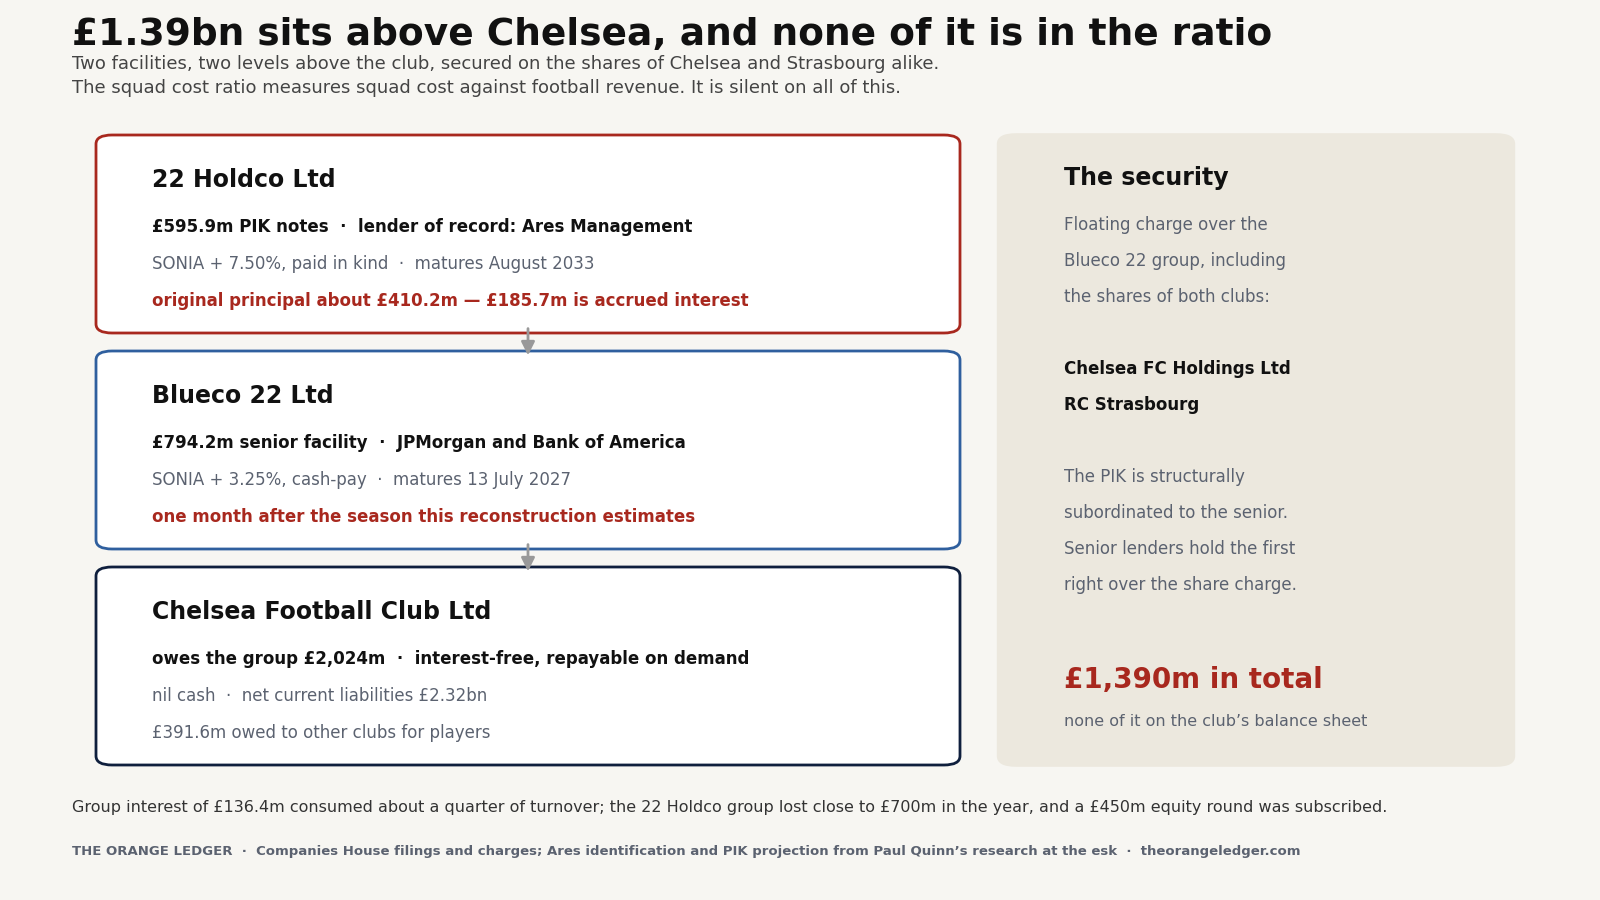
So £5bn including debt and £5bn of shareholder value are very different claims, and only the first is being reported.
The two reported numbers are broadly reconcilable, but not uniquely so. Boehly and Walter held 25.66% between them, and £950m for 25.66% implies equity of about £3.70bn. Adding the senior facility and the accreted PIK takes the implied enterprise value above £5bn; including net transfer payables pushes it higher still. Quinn therefore reads the consideration as consistent either with a £5bn headline that nets only external debt, or with a true enterprise value closer to £5.2–5.5bn.
Quinn has since published a full transaction analysis and reproduces the same arithmetic: £3,702m of implied equity from £950m divided by 25.66%.
What it does not do is establish that £3.7bn is what Chelsea’s shares are worth to anyone else.
The independent estimate is a long way below
Paul Quinn, who writes on football finance as the esk, published a full valuation of Chelsea on 18 August, before the deal was announced.
His central estimate was equity of about £1.0bn on a range of roughly £0.55bn to £1.5bn, against a central enterprise value near £2.8bn, roughly 5.0 to 5.5 times normalised revenue. He notes that the academic and discounted-cash-flow approaches break down entirely at this club, returning near-zero or negative values, because wages plus amortisation exceed revenue, a point the Orange Ledger’s own reconstruction reaches from the regulatory side.
On 11 September, when the talks were reported but unannounced, he tested the £5bn figure against that work. Working from the information available before the £950m consideration was reported, he estimated that a £5bn enterprise headline implied roughly £3.2bn of equity once the senior facility, the accreted PIK and about £300m of net transfer payables were deducted, on a revenue multiple near 9.3 times, and some 3.1 times his central estimate.
He also supplied the strongest available comparator. Liverpool’s minority sale in August 2026 valued that club at roughly £5.2–5.5bn, about 7.4 to 7.8 times revenue, for a profitable, stadium-owning recent champion. Constructing the most generous defensible case for Chelsea, a strategic buyer paying a Liverpool-level multiple, he reaches equity of £1.7–2.2bn.
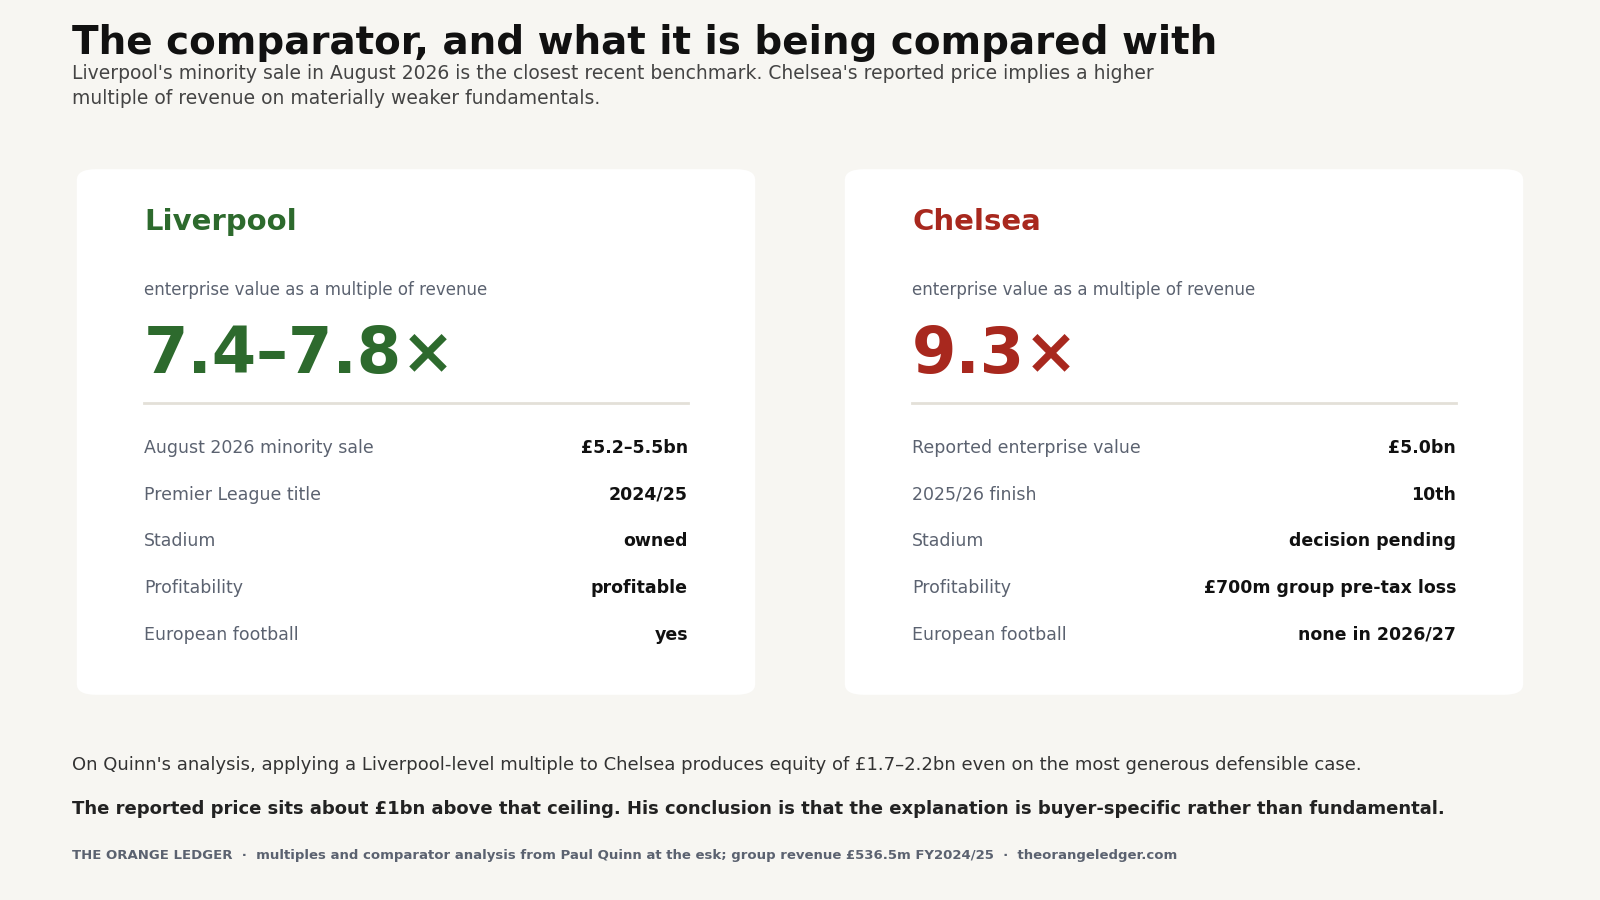
The reported price sits about £1bn above even that ceiling. Quinn’s conclusion is that the only credible justification is buyer-specific rather than fundamental.
That is his analytical judgement, not a disclosed motive, and it should be read as such. But the incentive structure behind it can be described without alleging anything.
Why a price can matter more to the buyer than to the shares being bought
Clearlake was not an outside bidder. It already owned 61.5% of Chelsea and was buying another 25.66% from its own consortium partners.
That creates an asymmetry that has nothing to do with football.
For every £1 of valuation premium paid on the block being acquired, a comparable per-share value applied across the company attaches to about £2.40 of the block already held, because 61.5 divided by 25.66 is 2.40.
Private equity funds mark their holdings at fair value, and a recent transaction in the same company is evidence of it. The 2025 International Private Equity and Venture Capital Valuation Guidelines treat a recent investment price as relevant calibration evidence, while stressing that it is not automatically fair value, and that a valuer must assess whether the transaction was orderly and representative of an arm’s-length exchange.
That caveat is doing real work here. This was not an auction. There were no competing bidders. The buyer was the majority shareholder, the sellers were its existing partners, and reporting has indicated the ownership arrangements limited their ability to sell elsewhere.
Quinn estimates Clearlake had deployed about £1.794bn into Chelsea by June 2025, with the wider Boehly and Walter group at about £1.106bn, on top of the original purchase price.
At £3.7bn of implied equity, Clearlake’s 61.5% is worth about £2.3bn, comfortably above Quinn’s estimate of its deployed capital to June 2025. At a £1.0bn equity valuation it is worth about £615m. The same holding, marked two very different ways, depending on which number is accepted as evidence.
Who is paying, and from which pocket
As Quinn sets out in his transaction analysis, the reported funding is Clearlake’s own capital plus direct personal investment by its co-founders, Behdad Eghbali and José E. Feliciano, with no new acquisition debt. He is clear that this is media reporting rather than a disclosure by any party to the transaction.
That is an important new detail. It is consistent with conviction: the principals are putting personal capital behind the same price. It also places them on both sides of a transaction that will inform the value attributed to capital held on behalf of the fund’s investors.
Quinn’s judgement is firmer than a bare description of the incentive: a single-buyer transaction under an exclusive option, with the principals investing personally, should not be treated as orderly and representative for calibration purposes.
No money reaches the club. It is a transfer between shareholders, and the balance sheets of the club, BlueCo 22 and 22 Holdco are unchanged by it.
None of that establishes that the price was set to support a carrying value. Clearlake bought four other things at the same time: complete control, the removal of a publicly divided shareholder structure, freedom over the stadium decision, and, with Walter under federal scrutiny over insurance businesses elsewhere in his group, a cleaner capital table ahead of a refinancing.
What it establishes is that the price has consequences well beyond the shares it bought.
What the sellers actually made
“A premium to initial investment” is technically accurate and economically thin.
On Quinn’s modelled cost basis, about £369m each of capital contributed to June 2025, across the 2022 acquisition equity and later calls, each seller receives about £475m.
| Capital contributed, each | £369m |
| Proceeds, each | £475m |
| Nominal gain | £106m |
| Multiple on invested capital | 1.29× |
| Sterling IRR over 4.6 years | 6.2% |
That falls to 2.5% if the owners called £500m of equity in 2025/26, which will not be visible until the 22 Holdco accounts are filed in March 2027. In dollars the base case is about 7.7%, helped by sterling’s recovery.
Against a risk-free rate of roughly 4% over the period, that is a small excess. Against the 8%-plus cost-of-equity hurdle Quinn applies to junior, leveraged, illiquid sporting equity, it is a shortfall.
There is a structural point underneath it. The 22 Holdco share classes are not symmetrical: Clearlake’s Class A carries downside protection on a return of capital, with the Boehly-side Class B absorbing losses first. At £3.7bn of equity that preference does not bite, so a pro-rata price is coherent. At £1bn it would bite hard, and a 12.8% junior interest would be worth materially less than 12.8% of the equity.
So under Quinn’s lower-value scenarios the sellers are treated more generously than a pro-rata split suggests. At the price actually paid, pro-rata is coherent; the generosity only appears once the preference would bite.
What Clearlake has taken full control of
This is where the Orange Ledger’s own work starts, because it approaches the club from the accounts rather than from the transaction. The full reconstruction is published separately: Chelsea’s squad cost ratio.
| Chelsea, 1 March 2027 test | |
|---|---|
| Regulatory SCR | 92.3% |
| Underlying SCR, before player trading | 115.4% |
| Amortisation | £262.7m, 57% of the revenue the rule counts |
| Effect of player-sale profits | 23.1 percentage points |
| Assumption range against the 115% red line | entirely below the line |
The squad is written down over the players’ contracts, and Chelsea bought in volume on very long contracts. The rule caps new contracts at five years, but the cap was not backdated, so deals signed before December 2023 keep their original spread: eight registrations carrying £311.9m of fees, led by Wesley Fofana at £70m over seven years, are still amortised that way. Players signed since, such as Estêvão, whose contract runs to 2033, are amortised over five years, and a new contract signed after the cut-off brings an older registration inside the cap too, as Moisés Caicedo’s did in April 2026. Amortisation is £262.7m against £459m of football revenue, up from a filed £212m mainly because of the signings since. Quinn’s own observation, that wages plus amortisation exceed revenue, still holds from the regulatory side.
The club finished tenth and has no UEFA distribution in the SCR denominator this season, leaving European revenue at nil, while last season’s commercial income, from a season in the Champions League, still counts, less the cost of the merchandise sold, because the rule takes it from the prior year, and the gate counts at the prior year’s receipts per home match. The commercial estimate contains no specific allowance for this European campaign.
And the gap between the underlying cost base and the regulatory figure is player trading: 26.8 points of it. Before the three-year average of sale profit is counted, the ratio is 115.1%, showing the cost base above the green threshold, and 0.1 of a point above the 115% at which the red line is set, before player trading is counted. A margin that small does not reliably tell which side of 115% that figure is on. The red line is tested on the ratio after player trading, 92.3%, which is well below it.
About 40% of that support is the current year: about £170m of disposal profit, led by Enzo Fernández’s £125m sale to Manchester City on deadline day, with Andrey Santos, Jackson, Delap and Chalobah behind him.
Why player trading is also a financing question
The regulatory point and the financing point are different, and it matters not to conflate them.
Accounting profit on a player is not cash in the bank. A £50m sale is typically paid in instalments; Chelsea’s own accounts show £391.6m owed to other clubs for players, £197.8m of it within a year, so the same is true in reverse. Disposal profit is proceeds against book value. Liquidity depends on when the money arrives.
But a club generating recurring disposal profits on this scale has something a lender can see. It holds an asset base that demonstrably converts. It generates receivables that can be collected or financed. And when an expensive registration leaves, the amortisation leaves with it.
That matters because of the date.
The £794.2m senior facility matures on 13 July 2027, one month after the end of the season this reconstruction estimates. The Ares notes mature in 2033 and compound in the meantime. Group interest reached £136.4m in 2024/25, a quarter of the group’s £536.5m turnover, and 22 Holdco reported a pre-tax loss near £700m.
It would be wrong to say Chelsea must sell a given amount to refinance. That will turn on sponsor support, lender appetite, security values, the stadium strategy, operating performance and the terms Clearlake will accept. Equity has been subscribed before (£450m in one recent year) and can be again.
What can be said is narrower and still substantial. A business asking creditors to refinance £794m by 13 July 2027, with no UEFA distribution in the SCR denominator this season and a subordinated instrument compounding above it, benefits materially from demonstrating that its largest asset class converts to cash. Chelsea’s trading does that. It is also, on the Orange Ledger’s reconstruction, the 23.1 points that separate a 115.4% underlying ratio from an 92.3% regulatory one.
The same activity is load-bearing in two separate structures at once.
What the deal does not change
It is a transaction between shareholders. It does not repay the senior facility, it does not stop the Ares notes compounding, and it does not make the squad cheaper.
And the Orange Ledger’s expiry analysis points the same way. Holding costs and revenue still and letting the three-year averaging roll forward (revenue is held at this season’s figures; next season’s commercial revenue is not forecast here):
| Test | Ratio on frozen costs |
|---|---|
| 1 March 2027 | 92.3% |
| 1 March 2028 | 98.6% |
| 1 March 2029 | 100.0% |
| 1 March 2030 | 115.4% |
Each row counts the sales of the six transfer windows before its test (Rule A.1.53). Enzo Fernández’s sale leaves the average at the 2029/30 test, and with no sale profit left the arithmetic reaches 115.4% without anything deteriorating, 0.4 of a point above the red line, a margin the estimate cannot reliably place on either side.
That is not a forecast. Chelsea can grow revenue, qualify for Europe, cut costs or sell more players, and a club whose current year alone holds about £170m of disposal profit is plainly capable of the last of those.
It is a description of the dependency. If nothing else changes, new trading has to keep replacing the old.
The question the headline doesn’t ask
The headlines have their number: £5bn.
The reporting itself is more careful than that headline. The Financial Times says £5bn including debt. Bloomberg says enterprise value. Neither says shareholders’ equity is worth £5bn, and the consideration implies about £3.7bn of it.
An independent valuation published a month ago puts that figure at around £1bn, and its author’s view is that the gap is explained by who the buyer is rather than by what the club is worth.
The Orange Ledger reaches the same business from the accounts and finds a squad costing £528m against £459m of the football revenue the rule counts, £261.2m of it amortisation, no UEFA distribution in the SCR denominator, £1.39bn of debt above the club and a senior maturity in July 2027.
Clearlake has not bought a finished asset generating surplus cash. It has bought complete control of a capital-intensive football business whose regulatory position currently depends heavily on profitable player trading, and whose financing position benefits materially from the same ability to turn registrations into cash.
The next test is not another valuation headline. It is the refinancing, and between now and July 2027, how much of Chelsea’s squad converts into cash is one of the more informative numbers to watch.
Corrections and updates (17)
26 September 2026 · Data correction · see the note
Update, 26 September 2026. Figures updated to the corrected Chelsea reconstruction: 87.6% regulatory, from 107.0%, and 110.1% underlying, from 134.1%.
27 September 2026 · Data correction · see the note
Update, 27 September 2026. The passage on long contracts below is corrected. It gave Enzo Fernández, Moisés Caicedo and Estêvão as examples of long contracts still spread over their full term, but Fernández has since been sold, Caicedo’s new contract of April 2026 brought his registration inside the five-year cap, and Estêvão, signed in 2025, was inside it from the start. The figures are unchanged.
1 October 2026 · Data correction · see the note
Update, 1 October 2026. Figures updated to Chelsea’s reconstruction with agents’ fees taken from the FA’s published figure rather than an estimate: 88.4% regulatory, from 87.6%, and 111.1% underlying, from 110.1%. The squad costs £529m, from £524m.
2 October 2026 · Data correction · see the note
Update, 2 October 2026. Figures updated to Chelsea’s corrected reconstruction: 88.6% regulatory, from 88.4%, and 111.3% underlying, from 111.1%. Amortisation is £256.6m, from £255.5m, and the squad costs £530m, from £529m; the frozen-cost table below now runs 88.6%, 91.6%, 98.4% and 111.3%. The passage on long contracts now gives eight grandfathered registrations carrying £311.9m rather than nine carrying £320.3m, because David Datro Fofana was sold to Servette on 31 August 2026. Marc Cucurella is removed from the list of this season’s sales: his sale completed in June 2026 and belongs to 2025/26.
3 October 2026 · Data correction · several figures: see the note
Update, 3 October 2026. Chelsea’s regulatory ratio is now 88.0%, from 88.6%; the underlying ratio is now 110.3%, from 111.3%; the football revenue the rule counts is now £480m, from £476m; amortisation is now 53% of that revenue, from 54%; the effect of player-sale profits is now 22.4 points, from 22.7; and the frozen-cost table now runs 88.0%, 90.9%, 97.6% and 110.3%, from 88.6%, 91.6%, 98.4% and 111.3%, after home matches were counted from match reports and last season’s matchday receipts were re-estimated (How we estimate matchday revenue). A separate review of agents’ fees on signings since the last accounts is under way and may raise this figure; we will report its result.
4 October 2026 · Methodology change · several figures: see the note
Update, 4 October 2026. Chelsea’s regulatory ratio is now 94.0%, from 88.0%; the underlying ratio is now 116.4%, from 110.3%; the squad now costs £529m, from £530m; the football revenue the rule counts is now £455m, from £480m; amortisation is now £256.1m, from £256.6m, and 56% of that revenue, from 53%; the averaged profit on player sales is now £108m, from £122m, and this season’s about £171m, from about £190m; the effect of player-sale profits is still 22.4 points; and the frozen-cost table now runs 94.0%, 97.3%, 103.4% and 116.4%, from 88.0%, 90.9%, 97.6% and 110.3%, after registrations were counted at the reported fee plus 12% and merchandise at gross profit, and cup prize money was rebuilt from each club’s cup ties (Three definitions in the squad cost rule, and what they change).
5 October 2026 · Methodology change · several figures: see the note
Update, 5 October 2026. Chelsea’s regulatory ratio is now 94.3%, from 94.0%; the underlying ratio is now 116.8%, from 116.4%; the squad now costs £532m, from £529m; amortisation is now £258.3m, from £256.1m, and 57% of the revenue the rule counts, from 56%; the averaged profit on player sales is now £109m, from £108m, and this season’s about £170m, from about £171m; the effect of player-sale profits is now 22.6 points, from 22.4; and the frozen-cost table now runs 94.3%, 97.6%, 103.9% and 116.8%, from 94.0%, 97.3%, 103.4% and 116.4%, after contract lengths were measured from their dates (the engine changelog).
7 October 2026 · New evidence · several figures: see the note
Update, 7 October 2026. Chelsea’s regulatory ratio is now 93.2%, from 94.3%; the underlying ratio is now 115.5%, from 116.8%; the squad now costs £525m, from £532m; amortisation is now £258.2m, from £258.3m, and still 57% of the revenue the rule counts; the averaged profit on player sales is still £109m; the effect of player-sale profits is now 22.3 points, from 22.6; and the frozen-cost table now runs 93.2%, 96.5%, 102.7% and 115.5%, from 94.3%, 97.6%, 103.9% and 116.8%, after the fee for Axel Disasi’s loan to Crystal Palace, an estimate of £6.0m, was counted as received and set against the cost of his registration (the engine changelog).
9 October 2026 · Methodology change · several figures: see the note
Correction, 9 October 2026. Chelsea’s regulatory ratio is now 92.5%, from 93.2%; the underlying ratio is now 114.4%, from 115.5%; the football revenue the rule counts is now £459m, from £455m; amortisation is still £258.2m, and now 56% of that revenue, from 57%; the effect of player-sale profits is now 21.9 points, from 22.3; and the frozen-cost table now runs 92.5%, 95.7%, 101.8% and 114.4%, from 93.2%, 96.5%, 102.7% and 115.5%, after last season’s commercial revenue, which is not yet filed, was estimated by one published method, the same for every club (how we estimate last season’s commercial revenue). The estimate is £219.4m: the £200.9m filed for 2024/25, grown by 9.2%. We had £215.0m; the earlier figure was a judgement of ours and is withdrawn. This article said the underlying ratio was above the 115% at which the red line is set, and that the last row of the frozen-cost table was above the red line; it now says the underlying ratio is 114.4%, 0.6 of a point below 115%, and that the last row of the table, which holds revenue at this season’s figures, is 0.6 of a point below the red line. A margin that small does not reliably tell which side of 115% either figure is on. The sentence that said last season’s commercial income was raised by the European campaign is replaced: the commercial estimate contains no specific allowance for that campaign.
15 October 2026 · Editorial · several figures: see the note
Clarification, 15 October 2026. Wording only; no figure changed. The ranges in this article are assumption ranges, the spread of the model’s inputs between assumed bounds, not calibrated or confidence intervals, and the share of modelled outcomes above the 115% red line that the table gave is withdrawn.
23 October 2026 · Methodology change · several figures: see the note
Correction, 23 October 2026. This article gave Chelsea’s regulatory ratio as 92.5%; the corrected figure is 88.6%, and the underlying 114.4% is unchanged. The rule averages the profit or loss on player sales in the six most recent transfer windows (Rules A.1.13 and A.1.53), and for the March 2027 test that period starts on 2 February 2024. We had averaged three financial years starting on 1 July 2024, and missed £73.8m of profit on Chelsea’s sales between February and June 2024, among them Ian Maatsen’s to Aston Villa and Lewis Hall’s to Newcastle. Player trading is worth 25.8 percentage points, from 21.9.
- Later tests: the frozen-cost figures for 2027/28 and 2028/29, 95.7% and 101.8%, are withdrawn while they are rechecked, because they took whole financial years out of the average. The 2029/30 figure, with no sale profit left at all, is unchanged at 114.4%.
- The argument stands: Chelsea’s regulatory position still depends heavily on profitable player trading. The full correction is in Chelsea’s squad cost ratio. See the engine changelog.
23 October 2026 (second) · Methodology change · several figures: see the note
Correction, 23 October 2026 (second of the day). This article gave Chelsea’s regulatory ratio as 88.6% and the underlying ratio as 114.4%; the corrected figures are 89.1% and 115.1%. Rule A.1.22(c) caps the spreading of a transfer fee at five years for any contract executed since 12 December 2023, and we had not applied the cap to four such contracts already in Chelsea’s filed book value (Jørgensen, Anselmino, Wiley and Samuels-Smith): charged over five years they add £3.0m, and amortisation is £261.2m. Before player trading Chelsea are now 0.1 of a point above the 115% at which the red line is set, where they were 0.6 below, a margin the estimate cannot place either way.
- Later tests restored: the expiry table’s figures for 2027/28 and 2028/29, withdrawn earlier today, are recomputed window by window (Rule A.1.53): 96.2% and 100.6%, against 95.7% and 101.8% before. The 2029/30 figure is 115.1%, from 114.4%.
- The argument stands: Chelsea’s regulatory position depends heavily on profitable player trading, now worth 25.9 percentage points. The standfirst, which still gave the figures of 9 October, a 92% ratio held there by £109m of averaged sale profit, now gives 89% and £134m. The full correction is in Chelsea’s squad cost ratio. See the engine changelog.
24 October 2026 · Data correction · several figures: see the note
Correction, 24 October 2026. Two figures the correction of 23 October did not reach. The squad costs £528m, from £525m, as the standfirst already says. And about 42% of the sale-profit average is this season’s profit, from about half, as in the Chelsea rebuild since 23 October. No conclusion changes.
25 October 2026 · Editorial · no figure changed
Correction, 25 October 2026. No figure changed. Four dated updates, of 26 and 27 September and 1 and 2 October, sat in the body above the table of Chelsea’s figures. Their figures were the ones of their day, 87.6% to 88.6%, and read as current beside a table at 89.1%; the update of 2 October described a frozen-cost table that now runs differently. They are records, so they have moved, unchanged, to the notes, where they now come first.
26 October 2026 · Regulatory interpretation · several figures: see the note
Correction, 26 October 2026. Fees paid and received for head coaches now count, and filed loan income is in the ranges. A fee one club pays another for a head coach is part of the squad cost, spread over his contract (Rule A.1.22(d)); compensation a club receives for releasing one counts with the profit on player sales (Rule A.1.29(g)). We had counted neither. Fees received for lending players count with the profit on player sales (the guidance to Rule A.1.29(g)); the accounts do not split them from wages recharged, so they widen the range and leave the central figures alone. Chelsea’s ratio is 88.3%, from 89.1%, because the £17.0m Manchester City paid Chelsea for releasing Enzo Maresca (reported in June 2026) counts with the sale profit. The averaged support is £139m, from £134m, worth 26.8 percentage points, from 25.9, and about 40% of it is the current year, from 42%. With no further selling the 2028 test is 95.2%, from 96.2%, and the 2029 test 99.5%, from 100.6%; 115.1% by 2030 is unchanged.
28 October 2026 · Data correction · several figures: see the note
Correction, 28 October 2026. We checked every transfer in our records against published sources and corrected sixteen entries at eleven clubs where the club’s announcement or a reputable report, read on the page, gives a different fee, contract length or date. Chelsea’s ratio is 88.6%, from 88.3%, and 115.4% before player trading, from 115.1%: Geovany Quenda’s and Pedro Neto’s guaranteed fees and Kian Best’s contract are corrected. Amortisation is £262.7m, from £261.2m, and the squad cost about £530m, from about £528m. With no further selling the 2028 test is 95.4%, from 95.2%, and the 2029 test 99.8%, from 99.5%; by 2030 the arithmetic reaches 115.4%, 0.4 of a point above the red line, from 0.1.
31 October 2026 · Data correction · SCR 88.6% → 92.3%
Correction, 31 October 2026. Chelsea’s ratio is 92.3%, from 88.6%. Bashir Humphreys and Kepa Arrizabalaga were counted twice, in 2024/25 by the accounts and in 2025/26 by us, and summer 2025 sale profit is now anchored to note 30 of the accounts of Chelsea FC Holdings: £31.8m, where we had modelled £82.4m. The ratio at the 2028 test is 98.6%, from 95.4%, and at 2029 100.0%, from 99.8%. Player trading is worth 23.1 points, from 26.8, and the three-year average of sale profit is £115m, from £139m. Figures that follow from these are restated with them in the text. The correction does not reverse the article’s conclusion.