
Regulation series
The history of financial rules in football, Part 4: the anchor that was voted down
Part 4 of the Orange Ledger's series on football's financial rules. When the Premier League's clubs voted in the squad cost ratio in November 2025, they also voted on a cap that would have tied the richest clubs' spending to the income of the club finishing bottom. Sixteen clubs had voted to explore it; only seven voted to adopt it. This is what anchoring was, what it would have changed for the biggest clubs, why support fell away, and the question it leaves behind.
Figures as of 3 November 2026, Orange Engine release V2CM · What the engine does not capture
Latest change to the figures, 31 October 2026: Liverpool’s figures in the cap table move with its filed sale profit. Latest correction, 3 November 2026: the vote count, the clubs the anchor would reach and the size of the anchor, with no club estimate changed. All 13 correction notes are at the end.
Parts 1 to 3 were about one question: how to stop clubs spending money they do not have. This part is about a different one. Should financial rules only stop clubs becoming insolvent, or should they also stop the most successful clubs becoming so rich that nobody else can realistically catch them?
The squad cost ratio answers the first question. It ties each club’s spending to its own revenue, so a club earning £800m a year can spend far more on its squad than a club earning £150m, and owner money cannot close the gap. The Premier League had a proposal for the second question too. It was called top-to-bottom anchoring, and the clubs rejected it.
What anchoring was
Anchoring would have set a single spending ceiling for every club, sitting on top of the squad cost ratio:
- No club could spend more on its squad than a set multiple, reported to be five times, of the central payments received by the club at the bottom of the Premier League.
- Squad costs meant the same as under the squad cost ratio: wages, transfer fees spread over each contract, and agents’ fees.
- Central payments are the broadcasting and prize money the League shares out.
Each club would have faced whichever limit was lower: its own squad cost ratio, or the anchor.
When the League first put anchoring forward for trial in June 2024, it described it as a league-level anchor based on a multiple of the forecast lowest central payment, and as a pre-emptive measure to protect competitive balance. It said the protection was intended to have no effect unless the revenues of clubs diverged significantly.
An anchor, not a fixed salary cap
The way the ceiling was built matters. It was not a fixed number like the salary caps in American sports. Because the anchor is a multiple of what the bottom club receives, anything that raises the bottom club’s central payments raises the ceiling for everyone:
- A bigger television deal lifts the equal share paid to every club, and so lifts the anchor.
- More money distributed to the bottom of the league also gives the top of the league more room.
The anchor would therefore have grown with the Premier League’s collective earning power, while stopping the top clubs growing much faster than the league as a whole.
What the anchor might have been in 2026/27
On 2023/24 figures, when Sheffield United finished bottom, the cap was reported to be about £550m.
The Orange Ledger has estimated an illustrative figure for 2026/27, using the League’s published payments for 2025/26:
| Bottom club’s central payments, 2025/26 | £m |
|---|---|
| Equal share, paid to every club | 100.0 |
| Prize money for finishing 20th | 3.8 |
| Facility fees for 10 televised matches, the minimum | 6.9 |
| Total | 110.7 |
| Five times the total | about 553 |
The £553m is an illustration built on the minimum facility fees, not the confirmed anchor. The League’s trial in 2024 described a multiple of the forecast lowest central payment for the season tested; reports of the final proposal in November 2025 described five times the bottom club’s central income, without saying which season. The exact definition was not published. On the bottom club’s actual payment in 2025/26, estimated from club sources at about £117.7m for Wolves, the anchor would be about £588m: Manchester City would still be above it, Liverpool’s squad costs would not, and the same four clubs would lose room at the 85% line, by less. Leaving facility fees out would give about £519m. This article works with £553m.
Who it would have limited
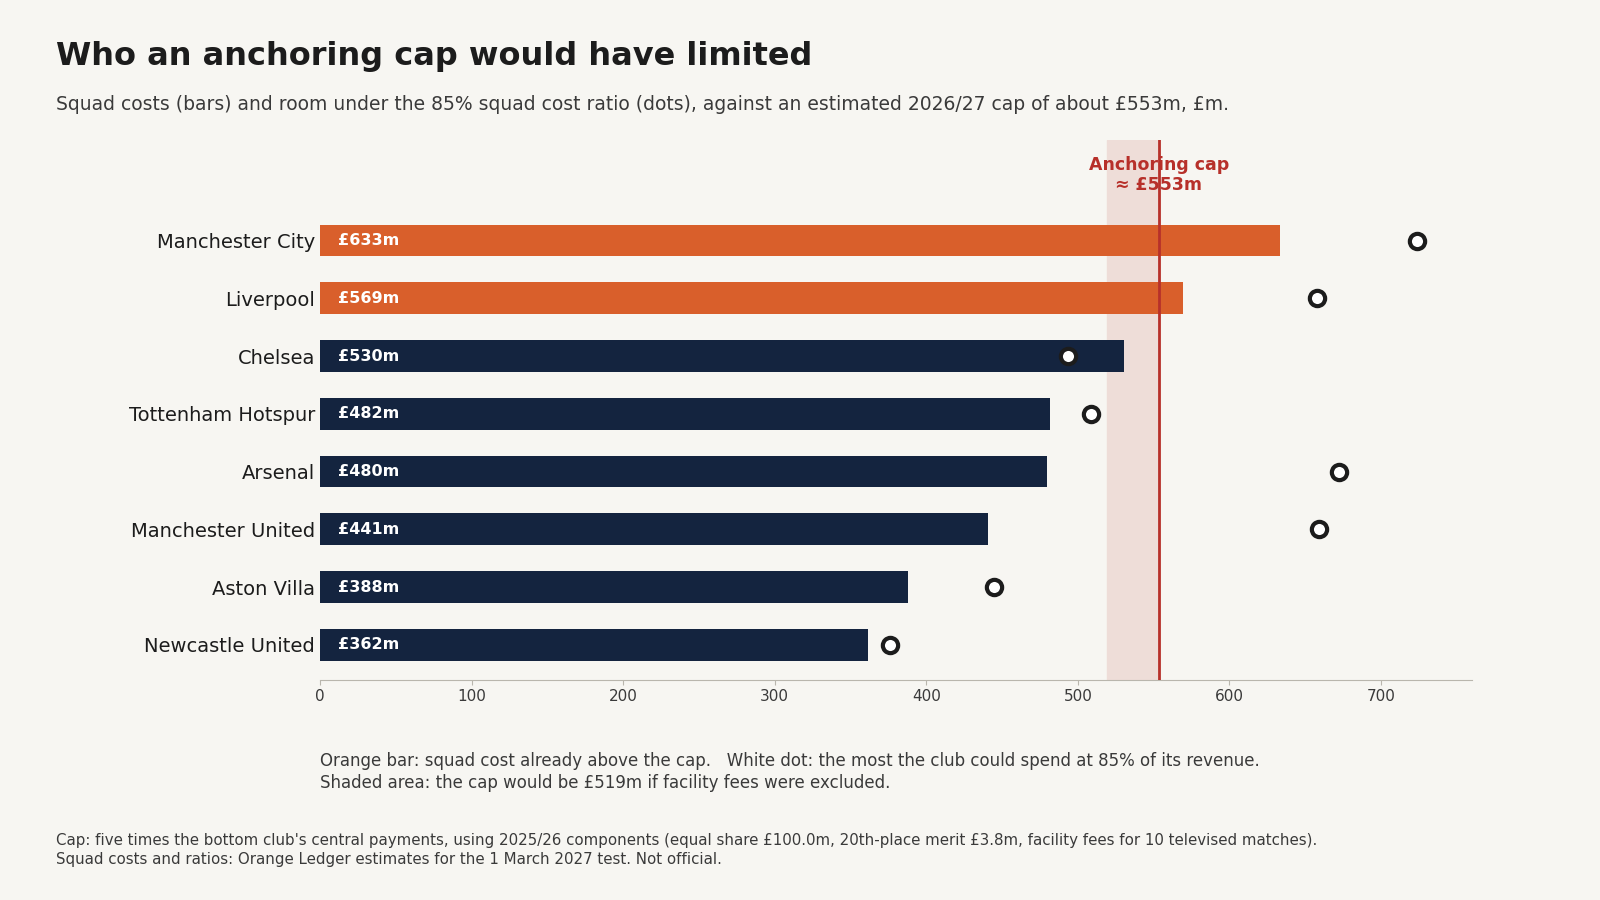
Two numbers matter for each club: what it spends on its squad now, and the most it could spend under the squad cost ratio. On the Orange Ledger’s estimates for the first test in March 2027:
- Manchester City and Liverpool are already above the anchor. City’s squad costs about £633m, about £80m over; Liverpool’s about £569m, about £16m over.
- Four clubs would have lost room they have under the squad cost ratio. At the 85% line, and against an anchor of £553m, the room removed each year would have been:
| Club | Most it could spend at 85% | Anchor | Room removed |
|---|---|---|---|
| Manchester City | about £724m | about £553m | about £171m |
| Arsenal | about £672m | about £553m | about £119m |
| Liverpool | about £658m | about £553m | about £105m |
| Manchester United | about £659m | about £553m | about £106m |
- At the 85% line, every other club would have been unaffected. For Chelsea, Tottenham, Villa, Newcastle and the rest, 85% already sets a lower limit than the anchor. A club can go above 85%, paying a levy and using its allowance up to the red line, 115% at the start, so the anchor could also have limited clubs that planned to spend into that allowance.
That makes the purpose of anchoring clear. It was not a lower spending limit for the Premier League. It was a second ceiling aimed almost entirely at the clubs with the highest revenues.
Room removed is not the same as transfer spending removed. Squad costs include wages and agents’ fees as well as transfer fees spread over each contract. A club facing the anchor could respond in several ways: lower wages, cheaper signings, selling before buying, or longer contracts that spread transfer fees more thinly within the five-year limit on spreading a fee, which applies to contracts signed or extended on or after 12 December 2023.
The League’s backstop may already have been reached. The League said anchoring should matter only if clubs’ revenues diverged significantly. On these estimates, that point had arrived by 2026/27: four clubs would face a lower ceiling under anchoring than under the squad cost ratio, and two are already spending above the anchor.
How the clubs voted
Anchoring was put to the clubs twice.
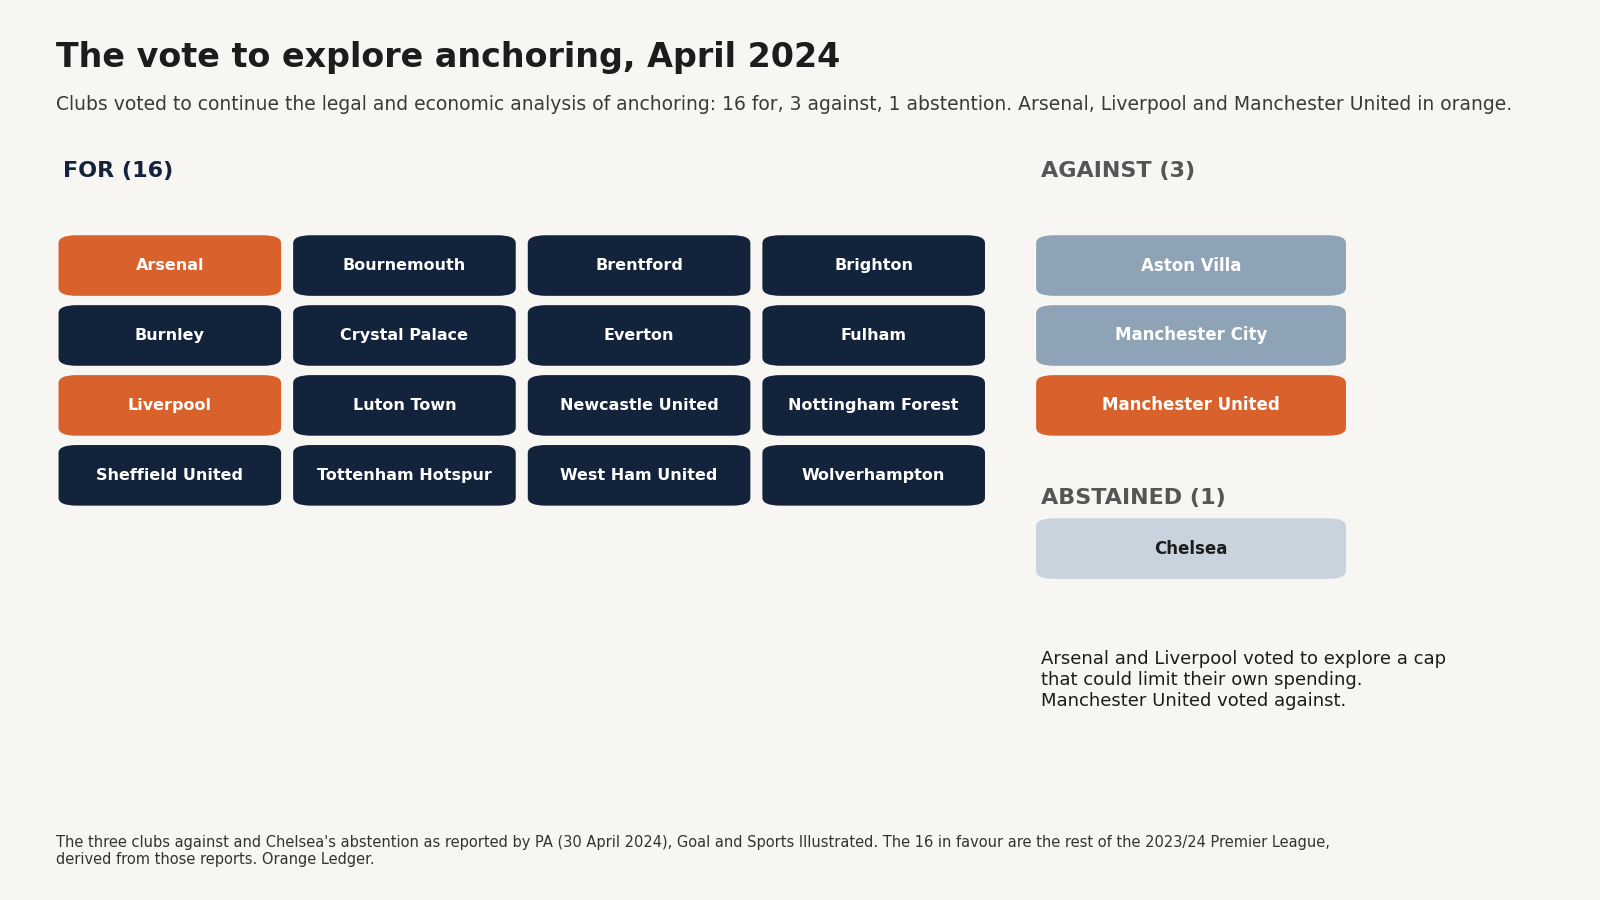
- April 2024: a vote to explore it. Sixteen clubs voted to continue the legal and economic analysis of anchoring. Manchester City, Manchester United and Aston Villa voted against, and Chelsea abstained. Manchester United was reported to object that anchoring would penalise clubs for revenues built over decades of success, and weaken English clubs against their European rivals. At the League’s annual meeting in June 2024, the clubs agreed to trial anchoring and the squad cost ratio behind the scenes, without sanctions.
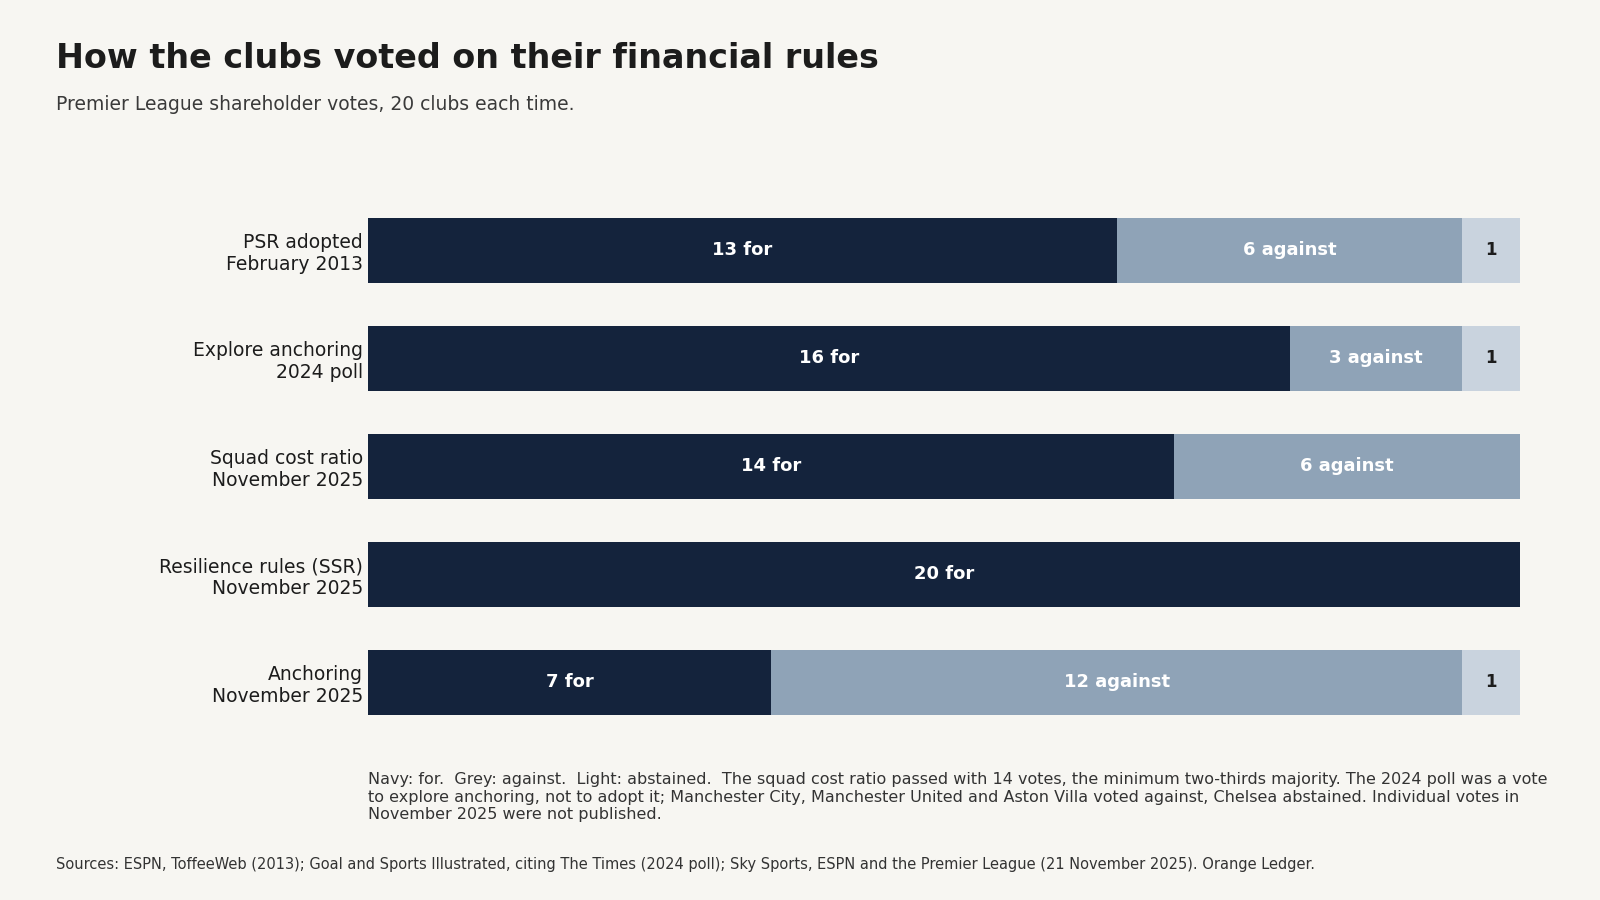
- 21 November 2025: the vote to adopt it. Seven clubs voted for, 12 against, with one abstention. On the same day, the squad cost ratio passed by 14 votes to six, the minimum needed, and the resilience rules passed unanimously.
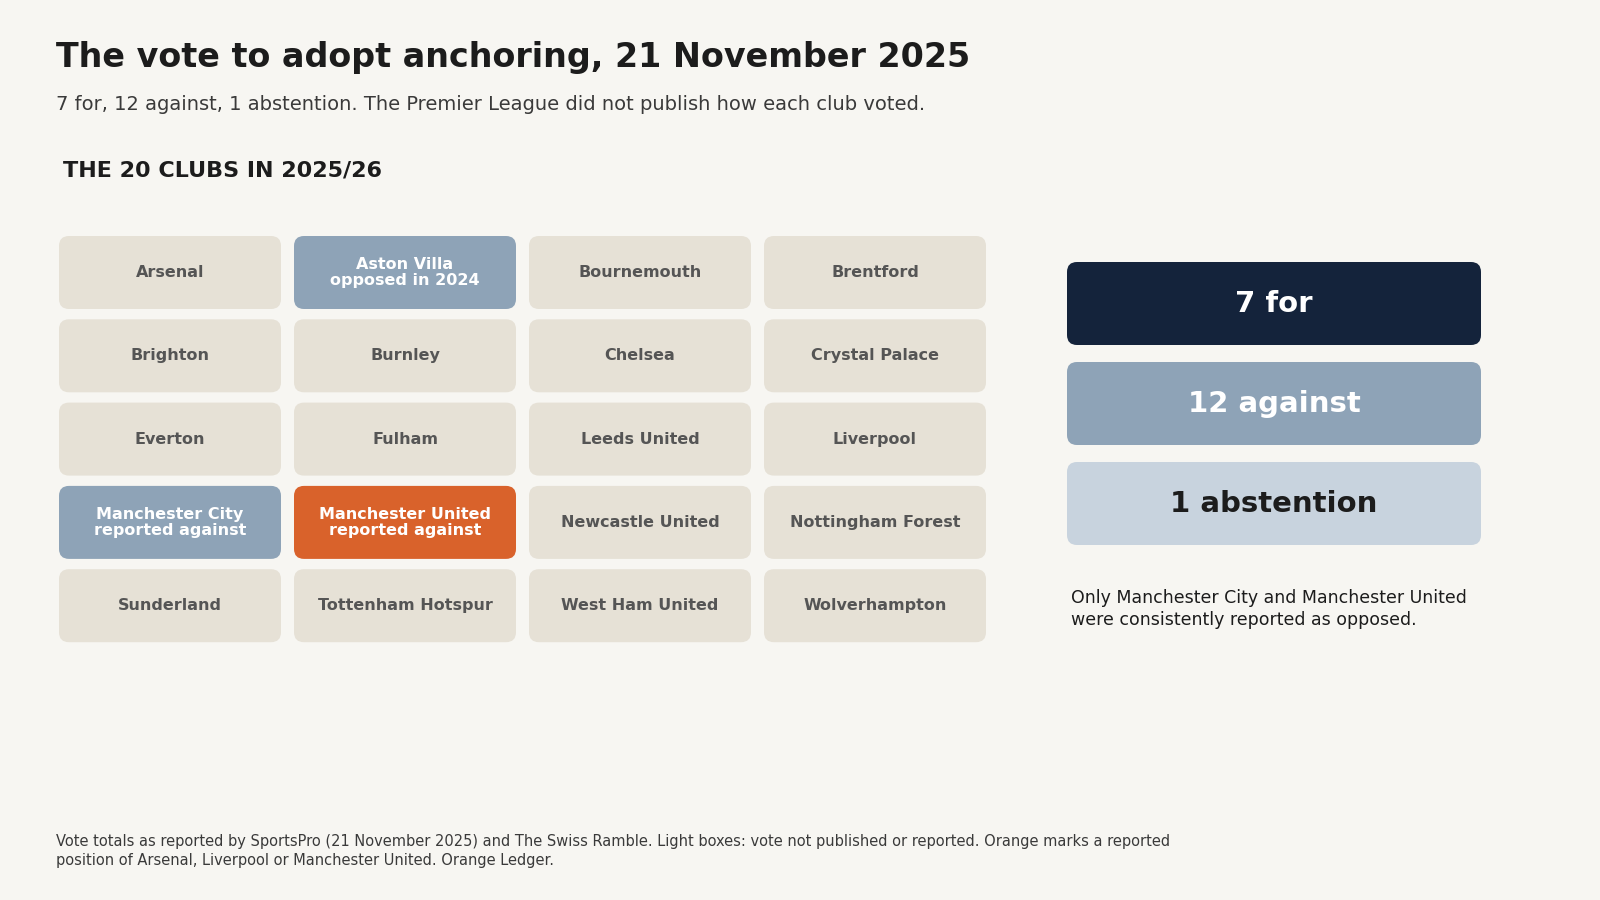
The League did not publish how each club voted in November 2025. Manchester City and Manchester United were consistently reported to oppose anchoring, and Aston Villa had opposed it in 2024. The six clubs reported to have voted against the squad cost ratio itself, the rule sometimes said to favour the biggest clubs, were Bournemouth, Brentford, Brighton, Crystal Palace, Fulham and Leeds United.
How 16 became seven
The fall in support is the most revealing part of the story. Anchoring did not fail only because the biggest clubs opposed it. City, United and Villa were against it from the start, and three votes could never block it alone. Two of the 16 clubs that voted to explore it, Luton Town and Sheffield United, had left the league by November 2025, so 14 remained; with only seven votes in favour, at least seven of them did not vote to adopt it. The individual votes were not published.
The reasons behind individual votes were not published, but four things changed between the two votes.
- The first vote was only permission to explore. Voting to study an idea costs nothing. Voting to bind the club to it is different.
- The idea became a number. During the trials, clubs could see what the anchor would mean in practice, and by November 2025 it was a concrete ceiling at five times the bottom club’s payments.
- The legal risk grew. The players’ union prepared a legal challenge, and three of the largest agencies warned of a claim under the Competition Act. The League had already spent years in arbitration over its rules on owner-linked deals, described in Part 2.
- The precedent worried people beyond the top clubs. The players’ union feared that a cap in the Premier League would encourage the English Football League to follow with its own.
The case against
Competing in Europe
The strongest economic argument against anchoring came from the biggest clubs. Manchester United’s co-owner, Sir Jim Ratcliffe, argued publicly that it would hold back the Premier League’s top clubs and leave them unable to compete with Real Madrid, Barcelona, Bayern Munich and Paris Saint-Germain, calling that outcome “absurd”.
The arithmetic behind the argument is simple. Take two clubs with the same £1bn of revenue and no profit or loss on player sales, both playing in the Champions League:
- A European club faces UEFA’s own squad cost rule, which limits clubs in its competitions to 70% of revenue, so it can carry up to £700m of squad costs.
- A Premier League club also faces UEFA’s 70%, but the anchor would have held it to about £553m.
A club in Spain or Germany would have been able to outspend an English club with the same income by about £150m a year. That does not prove Ratcliffe right, but it shows what his argument was.
The counter-argument is about the league as a whole. The Premier League’s value to broadcasters rests partly on its competitiveness, and supporters of anchoring argued that the collective product gains more from a closer domestic competition than individual clubs lose in European spending power.
Players and agents
The players’ union called anchoring a salary cap by another name. The anchor did not limit any individual player’s wages. But by fixing a ceiling on what each club could spend on wages, transfer fees and agents combined, it limited the total money available in the market for players, and so, in effect, what players could earn. The union retained the barrister Nick De Marco and said it could pursue legal action if anchoring was introduced. It had done so before: after a legal challenge in 2021, the union stopped the English Football League introducing salary caps in League One and League Two. The agencies CAA Stellar, CAA Base and Wasserman warned of a challenge under competition law for similar reasons.
The case for
Supporters argued that the squad cost ratio on its own lets the richest clubs pull further ahead, especially as extra income arrives from the expanded Champions League and FIFA’s Club World Cup, and that a ceiling linked to the bottom club would keep the league competitive and attractive to broadcasters.
The deeper argument is that a rule linked to revenue can create a loop. European qualification brings more revenue. More revenue raises the squad budget the rule allows. A bigger squad budget improves the chances of qualifying for Europe again, which brings still more revenue. Supporters saw anchoring as a way of limiting that compounding advantage at the top, without stopping successful clubs from spending more than the rest.
The Independent’s chief football writer, Miguel Delaney, makes a related argument: that the established clubs’ real advantage comes from decades of broadcasting and European prize money flowing to them, and that the financial rules should have been paired with a fairer distribution of money from the start. In his view, the squad cost ratio arrived without the anchoring mechanism that would have spread talent more widely.
What the vote tells us
- The rule that would have limited the biggest spenders was rejected. On the Orange Ledger’s estimates, anchoring would have constrained four clubs at the squad cost ratio’s 85% line: Arsenal, Liverpool, Manchester City and Manchester United.
- A simple “red cartel” explanation is hard to sustain. Manchester United openly opposed a rule that would have constrained its own spending, alongside Manchester City. Arsenal and Liverpool supported exploring anchoring in 2024, and the individual votes of 2025 were not published.
- Support fell across the league, not only at the top. At least seven of the clubs that voted to explore it did not vote to adopt it, many of them clubs the anchor would not have constrained at the 85% line on the Orange Ledger’s estimates.
- The problem anchoring was meant to solve remains. Under the squad cost ratio alone, a club’s limit is a share of its own revenue, and the clubs with the most revenue have the most room.
That leaves the question this part began with. If financial rules should also protect competition, there are several ways to do it: hold back the top, strengthen the bottom, change the percentage, or combine them. Part 5 argues for one of them: keep the link between spending and each club’s own income, make the limit tighter, and adjust it by where a club stands, in the way Formula 1 gives its strongest teams the least development time.
Next in the seriesPart 5: a better rule for the Premier League
Sources and caveats.
The proposal. The Premier League's statement of June 2024 on the shadow trial of the squad cost rules and anchoring, including its description of anchoring as a pre-emptive measure intended to have no effect unless revenues diverged significantly; Kennedys Law (2025) on the June 2024 annual meeting. The five-times multiple and the definition used in the November 2025 vote as reported by SportsPro and by AFP (Vanguard, 21 November 2025). The League's statement of 21 November 2025.
The votes. The April 2024 vote to explore anchoring (16 for; Manchester City, Manchester United and Aston Villa against; Chelsea abstaining) and Manchester United's reported objections as reported by PA (30 April 2024), Goal and Sports Illustrated; the 16 clubs in favour are the rest of the 2023/24 Premier League, derived from those reports. The £550m figure on 2023/24 figures as reported by Sports Illustrated, citing The Times. The 7-12-1 vote and the unanimous vote on the resilience rules as reported by SportsPro (21 November 2025) and The Swiss Ramble; the 14-6 vote on the squad cost ratio as reported by AFP (Vanguard, 21 November 2025). Luton Town and Sheffield United were relegated in 2024, and Leeds United and Sunderland were among the clubs voting in 2025. The six clubs voting against the squad cost ratio as reported by The Mag and The Esk.
Opposition. Sir Jim Ratcliffe as quoted by Goal and The Global Herald. The PFA's position, its barrister and its concern about the EFL as reported by The Global Herald, Goal and SportsPro; the 2021 arbitration ruling against EFL salary caps as announced by the EFL (9 February 2021); the agencies' warning as reported by SportsPro (November 2025).
Support. Arguments for anchoring as reported by The Global Herald and Goal. Miguel Delaney, The Independent and Inside Football (September 2026), cited as his view.
Orange Ledger estimates. The 2026/27 anchor is illustrative: it uses the League's published 2025/26 components (equal share £100.0m, prize money for 20th £3.8m) and facility fees for the minimum of 10 televised matches at an average of about £0.69m; the final rule's exact definition was not published. Wolves' 2025/26 central payment of about £117.7m is The Athletic's estimate from club sources, as reported by Yahoo Sports (May 2026), not a League figure. Squad costs and room under the squad cost ratio are the Orange Ledger's independent estimates for the 1 March 2027 test, published in the SCR table and club reconstructions. They are not official.
The full source register for this series is held with the Orange Engine.
Corrections and updates (13)
3 October 2026 · Data correction · several figures: see the note
Update, 3 October 2026. The room at 85% of revenue is now about £695m for Arsenal, from about £704m, about £681m for Liverpool, from about £671m, and about £641m for Manchester United, from about £635m, so the room the anchor would have removed is now about £142m, from about £151m, about £128m, from about £118m, and about £88m, from about £82m, after home matches were counted from match reports and last season’s matchday receipts were re-estimated (How we estimate matchday revenue). Manchester City’s figures are unchanged. The chart is redrawn: below the cap, Chelsea’s room is about £512m, from about £508m, Tottenham’s about £517m, from about £505m, Aston Villa’s about £446m, from about £449m, and Newcastle’s about £373m, from about £381m.
4 October 2026 · Methodology change · several figures: see the note
Update, 4 October 2026. Manchester City’s squad now costs about £619m, from about £611m, which is £66m over the anchor, from £58m, and Liverpool’s about £570m, from about £558m, which is about £17m over, from about £5m. The room at 85% of revenue is now about £691m for Manchester City, from about £700m, about £662m for Arsenal, from about £695m, about £656m for Liverpool, from about £681m, and about £639m for Manchester United, from about £641m, so the room the anchor would have removed is now about £138m, from about £147m, about £109m, from about £142m, about £103m, from about £128m, and about £86m, from about £88m, after registrations were counted at the reported fee plus 12% and merchandise at gross profit, and cup prize money was rebuilt from each club’s cup ties (Three definitions in the squad cost rule, and what they change). The chart is redrawn: squad costs are now £529m at Chelsea, from £530m, £481m at Tottenham, from £472m, £471m at Arsenal, from £462m, £442m at Manchester United, from £439m, £385m at Aston Villa, from £380m, and £357m at Newcastle, from £348m; below the cap, Chelsea’s room is about £479m, from about £512m, Tottenham’s about £498m, from about £517m, Aston Villa’s about £433m, from about £446m, and Newcastle’s about £360m, from about £373m.
5 October 2026 · Methodology change · several figures: see the note
Update, 5 October 2026. Manchester City’s squad now costs about £622m, from about £619m, which is £68m over the anchor, from £66m, and Liverpool’s about £571m, from about £570m, still about £17m over. The room at 85% of revenue is now about £695m for Manchester City, from about £691m, and about £663m for Arsenal, from about £662m, so the room the anchor would have removed is now about £142m, from about £138m, and about £110m, from about £109m, after contract lengths were measured from their dates and, at Manchester City and Newcastle, revenue from the rest of the club’s group was counted (the engine changelog). Liverpool’s and Manchester United’s rows are unchanged. In the chart, squad costs are now £532m at Chelsea, from £529m, £482m at Tottenham, from £481m, £474m at Arsenal, from £471m, £444m at Manchester United, from £442m, £387m at Aston Villa, from £385m, and £359m at Newcastle, from £357m; below the cap, Newcastle’s room is about £364m, from about £360m.
5 October 2026 · Regulatory interpretation · several figures: see the note
Update, 5 October 2026. The room at 85% of revenue is now about £658m for Manchester United, from about £639m, so the room the anchor would have removed is now about £105m, from about £86m, after United’s estimate was built on the accounts of the group the rule describes, where it had been built on the club company’s (the engine changelog). United’s row now sits above Liverpool’s. The chart is redrawn; United’s squad cost is unchanged at £444m.
7 October 2026 · New evidence · several figures: see the note
Update, 7 October 2026. The room at 85% of revenue is now about £699m for Manchester City, from about £695m, so the room the anchor would have removed is now about £146m, from about £142m, and City’s squad is now £69m over the anchor, from £68m, after each club’s inputs were checked against its own announcements, the League’s squad lists and its filed accounts (the engine changelog). The other three rows are unchanged. The chart is redrawn: Chelsea’s squad cost is now £525m, from £532m.
7 October 2026 (second) · Regulatory interpretation · several figures: see the note
Update, 7 October 2026, second correction of the day. The room at 85% of revenue is now about £701m for Manchester City, from about £699m, and about £677m for Arsenal, from about £663m, so the room the anchor would have removed is now about £148m, from about £146m, and about £124m, from about £110m, after the home gate was counted for five European home matches at City and seven at Arsenal, where we had counted four at each (how we count matchday revenue). Manchester United’s and Liverpool’s rows are unchanged. The chart is redrawn.
9 October 2026 · Methodology change · several figures: see the note
Correction, 9 October 2026. The room at 85% of revenue is now about £717m for Manchester City, from about £701m, about £672m for Arsenal, from about £677m, and about £665m for Liverpool, from about £656m, so the room the anchor would have removed is now about £164m, from about £148m, about £119m, from about £124m, and about £112m, from about £103m, after last season’s commercial revenue was estimated by one published method for every club, where each figure had been a judgement of ours (how we estimate last season’s commercial revenue). Manchester United’s row is unchanged, and Liverpool’s row now sits above it. The chart is redrawn: below the cap, Chelsea’s room is about £483m, from about £479m, Tottenham’s about £510m, from about £498m, Aston Villa’s about £424m, from about £433m, and Newcastle’s about £361m, from about £364m. Squad costs are unchanged.
23 October 2026 · Methodology change · several figures: see the note
Correction, 23 October 2026. The squad costs and the room under the 85% ratio this article gives for each club were left at the figures of 9 October when later releases moved them, and are restated. Those releases recorded every club’s players out on loan, averaged the profit on player sales over the six most recent transfer windows (Rule A.1.53) and applied the five-year cap to contracts already on the books (Rule A.1.22(c)). Manchester City’s squad now costs about £627m, £74m over the anchor, from £622m and £69m, and Liverpool’s about £569m, about £16m over, from £571m and £17m. The room the anchor would have removed is now about £171m at City, from £164m, and about £106m at Manchester United, from £105m; Arsenal and Liverpool are unchanged. In the chart, squad costs are £529m at Chelsea, £483m at Tottenham, £475m at Arsenal, £441m at United, £388m at Villa and £360m at Newcastle. The chart is redrawn; the argument does not change. See the engine changelog.
25 October 2026 · Data correction · no change to the argument
Correction, 25 October 2026. The chart printed three squad costs one pound too high, by rounding figures that had already been rounded: Chelsea’s is £528m, from £529m, Tottenham’s £482m, from £483m, and Newcastle’s £359m, from £360m. The chart is redrawn and its description corrected. The note of 23 October also gave the chart’s new figures without the old ones. Against the chart of 9 October, squad costs are £528m at Chelsea, from £525m, £482m at Tottenham, unchanged, £475m at Arsenal, from £474m, £441m at United, from £444m, £388m at Villa, from £387m, and £359m at Newcastle, unchanged; the room at 85% of revenue is about £504m at Chelsea, from £483m, £507m at Tottenham, from £510m, £445m at Villa, from £424m, and £376m at Newcastle, from £361m. That note’s five-year cap applies to contracts signed or extended on or after 12 December 2023 (Rule A.1.22(c)), as the sentence on longer contracts now says.
26 October 2026 · Regulatory interpretation · several figures: see the note
Correction, 26 October 2026. Fees paid and received for head coaches now count, and filed loan income is in the ranges. A fee one club pays another for a head coach is part of the squad cost, spread over his contract (Rule A.1.22(d)); compensation a club receives for releasing one counts with the profit on player sales (Rule A.1.29(g)). We had counted neither. Fees received for lending players count with the profit on player sales (the guidance to Rule A.1.29(g)); the accounts do not split them from wages recharged, so they widen the range and leave the central figures alone. Manchester City’s squad cost is about £633m, from about £627m, because the fee City paid for Enzo Maresca counts in it, so City are about £80m over the anchor, from £74m. Newcastle’s squad cost is £362m, from £359m, for the fee Newcastle paid for Matthias Jaissle, and Chelsea’s room at 85% of revenue is about £509m, from £504m, for the compensation Chelsea received for Enzo Maresca; the chart is redrawn.
28 October 2026 · Data correction · several figures: see the note
Correction, 28 October 2026. We checked every transfer in our records against published sources and corrected sixteen entries at eleven clubs where the club’s announcement or a reputable report, read on the page, gives a different fee, contract length or date. Chelsea’s squad cost is about £530m, from about £528m, and Arsenal’s about £480m, from about £475m.
31 October 2026 · Data correction · several figures: see the note
Correction, 31 October 2026. Liverpool’s most it could spend at 85% is about £658m, from about £665m, and the room removed about £105m, from about £112m, because its filed sale profit of £104.7m replaces our modelled £132.5m, which lowers the three-year average in its revenue. Figures that follow from these are restated with them in the text. The correction does not reverse the article’s conclusion.
3 November 2026 · Correction · chart figures: see the note
Correction, 3 November 2026. The vote: the article said at least nine clubs besides City, United and Villa declined to back anchoring between 2024 and 2025. Two of the 16 that voted to explore it, Luton Town and Sheffield United, were no longer in the league in 2025, so the votes show at least seven, not nine. Who the anchor would reach: the article said every club other than the four would have been unaffected. That holds at the 85% line, but a club can spend above 85% into its allowance, so the anchor could also have limited others. The size of the anchor: the article’s £553m counts facility fees for the minimum number of televised matches. The article now says the £553m is an illustration, not the confirmed anchor, and that the definition was not published. The bottom club’s actual 2025/26 payment, estimated at about £117.7m for Wolves, would give about £588m, which would leave Liverpool’s squad costs below the anchor and City’s above it. The four-club conclusion now says it holds at the 85% line. The European example now states that neither club has a profit or loss on player sales, a single unconfirmed report of Arsenal’s 2025 vote is no longer repeated in the text, and the sources no longer name outlets this publication does not cite. The chart is redrawn, with its description. Liverpool’s room at 85% is about £658m, from about £665m, as the table and the note of 31 October already said. Chelsea’s is about £494m, from about £509m: about £488m on 31 October, when Chelsea’s profit on player sales in 2025/26 was taken from its filed accounts (£31.8m, note 30), then about £494m on 1 November, when Omari Hutchinson’s sale was restored to the March 2027 test under the rule on transfer windows (Rule A.1.53). The notes of those dates did not restate the chart. Tottenham’s is about £509m, from about £506m, because Tanguy Ndombele’s contract ended on 30 June 2024, not 2025, so less of his registration was written off when it ended. The chart’s description had given Tottenham’s room as about £507m, from the note of 25 October; the chart had shown about £506m since the transfer corrections of 28 October, which that note did not restate. Squad costs and the £553m illustration are unchanged. The 2025 vote graphic is redrawn without the Arsenal report, and its sources no longer name outlets this publication does not cite.