
Regulation series
The history of financial rules in football, Part 5: a better rule for the Premier League
Part 5 of the Orange Ledger's series on football's financial rules, and a signed opinion piece. The Premier League's clubs lost almost £1bn before tax in 2024/25, and clubs well inside the new 85% squad cost limit are still cutting jobs. My proposal: bring the limit down to 60% over five years, give promoted clubs extra room, squeeze the clubs that stay at the top, the way Formula 1 gives its strongest teams the least development time, and build a real-time financial monitoring system around it.
Figures as of 31 October 2026, Orange Engine release V2CI · Latest figures · What the engine does not capture
Latest change to the figures, 31 October 2026: Chelsea’s ratio is 92.3%, from 88.6%, and the gap to 60% is £1.26bn, from £1.24bn. Latest corrections, 3 November 2026: three figures in the text and the chart’s description brought into line with the chart, and four statements in the argument made more precise. All 17 correction notes are at the end.
I worked in telecoms through 2001 and 2002, and I saw what happens when the accounts run ahead of reality. Five-year contracts were booked as profit up front, while the costs of delivering them were spread across the life of the contract. It worked, until the truth came out: there was not enough demand for data to fill the networks that had been built for it. It was a house of cards. The share price of the company I worked for fell by about 95%. The company survived, but only after laying off around 60% of its staff.
Reading Premier League accounts, I recognise the pattern. When a club sells a player, the profit lands in that year’s accounts; when it buys one, the fee is spread over the length of his contract. Part 2 showed how that difference in timing flatters a club’s results. Revenue keeps growing, costs keep growing faster, and the accounts make it look more affordable than it is.
My view is that the new SCR limit of 85% is not a sustainable level for English football. It is better than what came before, and Parts 1 to 4 explain why. But it lets clubs spend almost every pound they earn on their squads, and it leaves them little or nothing for everything else a football club has to pay for. Here is what I would do instead, and the evidence behind it.
The evidence: 85% leaves nothing over
Start with the simplest fact about Premier League finances: the league does not make a profit. Over the last five seasons its clubs’ revenue grew by 39%, from £4.9bn to £6.8bn. In every one of those seasons they lost money before tax, £3.1bn in total.
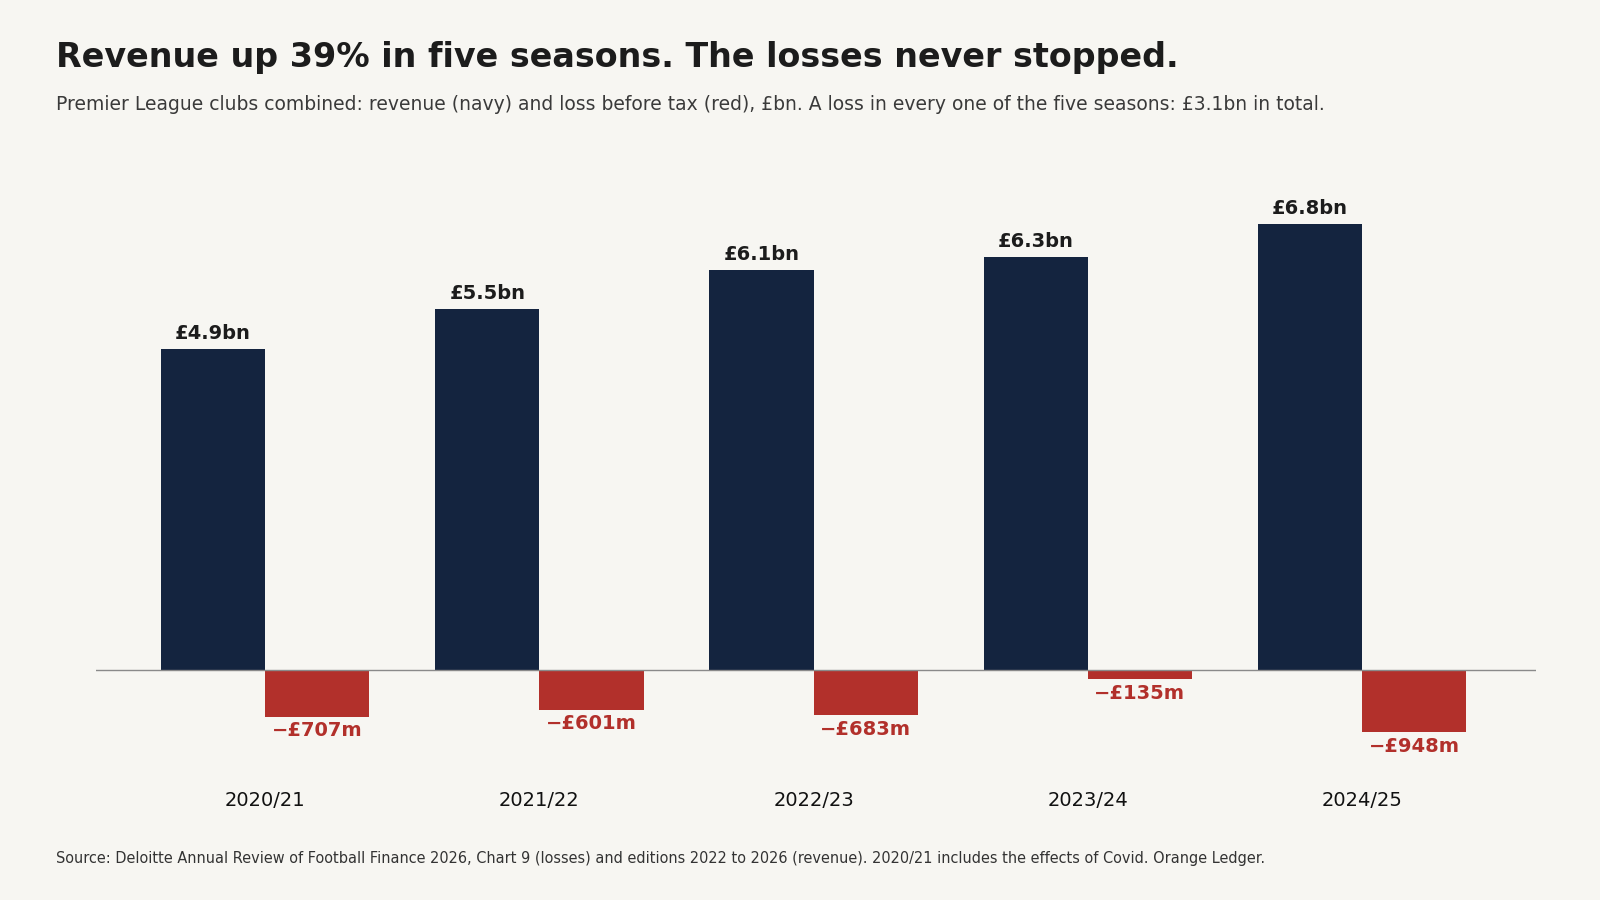
Every extra pound the league earned in those five years was spent, and more besides.
Deloitte’s annual review of football finance also shows where the money went in the latest of those seasons, 2024/25.
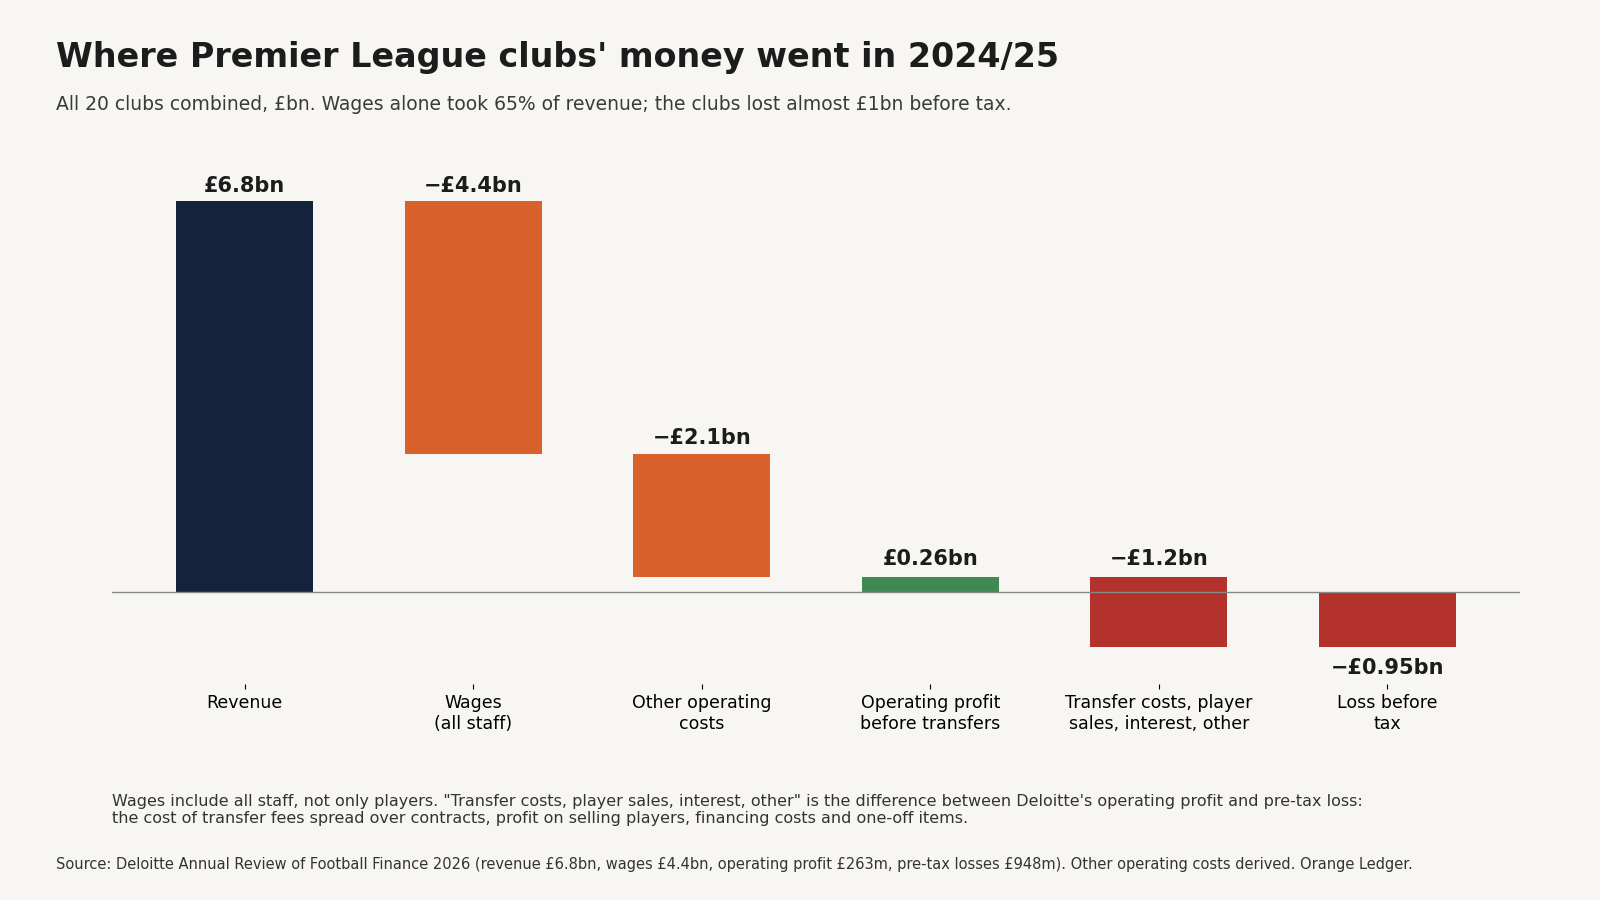
- Revenue reached £6.8bn, a record.
- Wages took £4.4bn, 65% of it. That is every member of staff, not only players, but players and coaches are by far the largest part.
- Everything else the clubs spent to run their businesses (stadiums, travel, marketing, administration) took about £2.1bn, or roughly 31% of revenue.
- That left an operating profit of just £263m before any spending on transfers.
- After the cost of transfer fees, player sales, interest and one-off items, the clubs lost £948m before tax, up from £135m the season before.
That is with wages at 65% of revenue. The SCR counts player and head-coach wages, the cost of transfer fees spread over each contract, and agents’ fees, and allows all of that to reach 85% of revenue plus player-sale profit.
The Orange Ledger can estimate where the break-even point sits. If about 31% of revenue goes on other operating costs, and staff who are not players or the head coach account for between a tenth and a fifth of the wage bill, then the share of revenue left for squad costs, before any profit on selling players and before interest, is roughly 56% to 62%. That suggests that, for the league as a whole, sustainable squad spending sits somewhere in the high-50s to low-60s as a share of revenue, before interest, and depending heavily on each club’s own cost structure. That is not the same as an SCR of 60%. The SCR also counts averaged profit on player sales in its base, so a club with sale profit can meet an SCR of 60% while spending more than 60% of its revenue on its squad. Around 60% is therefore the starting point of my proposal, not a proven break-even level, and it has to be tested against whether clubs actually make a profit. Above that range, the typical club would be under increasing pressure to cover the rest of its operating costs. At an SCR of 85%, the margin left for the rest of the business is extremely thin.
The clubs’ own behaviour tells the same story.
- Manchester United sit at an SCR of 56.9% on the Orange Ledger’s figures, well inside the new limit, yet ran cash shortfalls of £89m, £201m and £50m in the last three seasons and cut about 450 jobs.
- Arsenal, at an SCR of 60.7%, won the Premier League last season, yet the Telegraph reported in September that staff fear job cuts after a review of the business by the consultants Boston Consulting Group. Final decisions had not been made. The club’s accounts show seven consecutive years of losses.
- Transfer spending is accelerating. UEFA’s report on the European club game found that Premier League clubs spent an estimated €4.6bn on transfers in summer 2026, equal to 56% of their annual revenue, against an average of 33% in the decade before Covid.
When clubs with an SCR of around 60% are cutting jobs, and the league as a whole loses almost £1bn a year, an SCR limit of 85% is not a limit on overspending. It is permission.
I would go further. In my view, starting the new system at 85%, when UEFA’s equivalent limit for clubs in its competitions is 70%, was a financial disaster in the making. The first summer under the new rules has already shown the danger. Premier League clubs committed a record £3.48bn in transfer fees, Sky Sports reported, a count of its own and not UEFA’s, and UEFA’s report found that of the 35 transfers across Europe worth more than €50m, 29 involved Premier League clubs. I cannot prove that the 85% limit caused that frenzy. But a rule that leaves 15 points more room than Europe’s, at the moment English clubs had never been richer, was never going to slow it down.
Why profit matters: it is what brings investment
The Premier League lost almost £1bn in 2024/25 on revenue of £6.8bn. That shapes who can afford to own a club, and on what terms.
Today, an outside investor buying a Premier League club is buying a business that, on average, loses money. The route to a profit runs through success on the pitch: a higher league position, then European football, then the revenue that comes with it. To get there, the new owner usually has to spend more, and lose more, first. Many never reach the profitable end. Even Arsenal, champions of England, have made losses for seven years in a row.
That is why so much of the league is owned by people who can afford to lose money: billionaires, states and investment funds prepared to fund losses for years. A regulatory framework that allows clubs to operate on a profitable basis would widen that circle. A club that can make money in the ordinary course of running a football club is worth more, can borrow on better terms, and can attract investors who expect a return on their capital rather than a place in the queue to cover the next loss.
The risk the existing rules do not fully capture: clubs owe each other billions
There is a second reason the current level worries me, and it is the one I recognise most clearly from telecoms. In 2001, the companies in that industry were bound together: suppliers lent customers the money to buy their equipment, and companies were each other’s customers and creditors. When one fell, it pulled others with it.
Football has built its own version. Most transfer fees are not paid when a player moves. They are paid in instalments over three to five years, so every transfer creates a debt from one club to another. Paul Quinn, who analyses football finance at The Esk, has pieced together what that adds up to from the clubs’ accounts:
- At 30 June 2025, Premier League clubs owed £3.5bn in transfer fees to other clubs, and were owed £1.25bn. That was more than their combined bank and other third-party loans.
- In 2025/26, about £1.1bn of those instalments fell due, against combined cash from operations of under £200m in the previous season. At league level, operating cash generation is nowhere near enough to cover those instalments. The gap has to be met through some combination of player sales, owner funding and borrowing.
- About 40% of this summer’s record spending was on deals between Premier League clubs, each of them both a creditor and a debtor of the others. Quinn estimates that the total owed in transfer fees could reach about £5.5bn by mid-2027.
The chains run deep. When Chelsea signed Morgan Rogers from Aston Villa for £117m this summer, Villa owed Middlesbrough a sell-on payment of about £20m, and Middlesbrough in turn owed a share to Manchester City. Middlesbrough’s money depends on Chelsea paying Villa on time, yet Middlesbrough has no contract with Chelsea and no sight of its finances.
Money from outside football is now woven into the chain. Clubs sell the instalments they are owed to specialist lenders for cash now, and borrow from private credit funds at rates that have run from around 9% to 12%, and, at Everton under its previous ownership, as high as 18%. None of these obligations is recorded in any central register.
That is how a domino could fall. If a heavily indebted club fails to pay, or a lender pulls back, the clubs waiting for its instalments are left short, and some must sell players to cover the gap.
The current SCR level makes that chain more fragile, not less. On the Orange Ledger’s estimates, three clubs are clearly above an SCR of 85%; Chelsea’s central estimate is 92.3%, in an assumption range of 82.9% to 96.8% that reaches below the line; Bournemouth’s central estimate is 85.4%, in an assumption range of 78.3% to 86.9% that spans the line, so the estimate does not reliably tell which side of the line the club is on; and four more clubs’ central estimates sit between 79% and 85%: Brentford, Tottenham, Newcastle and Brighton. For two of those four the estimate does not reliably tell which side of the line the club is on either: Tottenham’s central estimate is 80.9%, in an assumption range of 77.0% to 86.4% that spans the line, and Newcastle’s is 81.7%, in an assumption range of 76.4% to 85.5% whose top is just above it. Brentford’s is 81.6%, with its range, 75.3% to 84.7%, just below the line, and Brighton’s is 79.1%, with its range, 70.8% to 82.1%, wholly below it. Many of them only get there because profit from selling players is counted as revenue. Take that profit out and the underlying position is much worse: Chelsea’s SCR of 92.3% rests on about £115m a year of player-sale profit, and without it the club’s squad would cost roughly 115% of its revenue. A league full of clubs running close to the limit, and relying on sales to stay under it, is a league in which one missed payment can start a chain of liquidity pressure and forced selling.
A wave of forced sellers could push transfer prices down. And falling transfer fees hit hardest the clubs that rely on profit from selling players to stay within the SCR, because that profit counts towards their revenue: their limit shrinks just as their costs are due. The resilience rules count 40% of a squad’s market value as cash a club could raise; in a crisis, when everyone is selling at once, that value is exactly what disappears.
The Football League has already seen the end of this story. Sheffield Wednesday went into administration in October 2025. When the club was sold in May 2026, other football clubs were paid in full under the League’s rules, while many other unsecured creditors received 25p in the pound. The rules decided who bore the loss. They did nothing to prevent it.
A lower SCR reduces the pressure behind all of this: clubs that spend less of their revenue on squads need less credit, and depend less on player sales to stay compliant. And the monitoring below would start with the obvious gap, a register of what every club owes every other.
My proposal
The aim is simple to state. In the long run, Premier League clubs should be able to make a profit from football. Within that, the clubs that need it because of where they stand should have room to spend more, without being able to wreck themselves financially.
The proposal keeps everything the Premier League has already built: the SCR, the levy, the allowance that shrinks with each breach and recovers with compliance, and the separate resilience tests. It changes three things, and adds a fourth.
1. A lower base, reached gradually. The base SCR limit falls by 5 points a year, from 85% to 60%:
| Year | 1 | 2 | 3 | 4 | 5 | 6 onwards |
|---|---|---|---|---|---|---|
| Base SCR limit | 85% | 80% | 75% | 70% | 65% | 60% |
If experience shows that an SCR of 60% still does not let clubs make a profit, the League should lower the base to 55%. The base should be set by evidence, and reviewed.
2. A club adjustment of up to 10 points either way, moving by no more than 2 points a year.
- Promoted clubs start 10 points above the base and lose 2 points for every season they stay up, reaching the base after five seasons. Promoted clubs can devote a larger share of their revenue to establishing their squads, with owners free to provide the capital needed to support that transition.
- Clubs in the top five, measured on their average finish over the last three seasons, lose 2 points a year, down to 10 points below the base: an SCR of 50% once the base is 60%. Because the average needs three seasons of the new rules, this squeeze starts only in year 4.
- A club that drops out of the averaged top five regains 2 points a year, back to the base.
The adjustment is deliberately based on sustained success on the pitch, not on revenue. Revenue is already rewarded by the SCR itself: a club that earns more can spend more. Using revenue a second time would compound the same advantage. A three-year average stops one exceptional season, or one bad one, from changing a club’s allowance, and a band of five captures the clubs that consistently occupy England’s European places without tying the rule to a single season’s table. The three-year average and the 2-point steps make the system hard to game: one finishing position cannot produce a large immediate change, and falling out of the top five brings back only 2 points a season.
For a club that stays at the top throughout, the path looks like this:
| Year | 1 | 2 | 3 | 4 | 5 | 6 | 7 | 8 |
|---|---|---|---|---|---|---|---|---|
| Base SCR limit | 85% | 80% | 75% | 70% | 65% | 60% | 60% | 60% |
| Top-five adjustment | 0 | 0 | 0 | -2 | -4 | -6 | -8 | -10 |
| SCR allowance | 85% | 80% | 75% | 68% | 61% | 54% | 52% | 50% |
3. A tighter band. Today, a club can spend up to 30 points above an SCR of 85% before it loses points. I would halve that to 15 points above each club’s own SCR allowance. Once the base is 60%, an established club would lose points above an SCR of 75%, a top-five club above 65%, and a newly promoted club above 85%: the level at which today’s rule only starts to charge a levy.
4. Monitoring in close to real time. A rule based on revenue is only as good as the figures behind it. Much of the machinery already exists:
- FIFA has recorded every international transfer in its Transfer Matching System since 2010. Since November 2022, its Clearing House, an independent institution in Paris regulated by the French banking supervisor, has handled the payments owed to the clubs that trained a player, calculating them automatically and paying them directly. Training clubs now receive around four times what they did before.
- UEFA collects clubs’ accounts and checks for unpaid debts as a condition of playing in its competitions.
- The Premier League tests owner-linked deals against a database of market values, and monitors the SCR during the season, in October and in March.
- England’s new independent regulator now sits above the clubs with legal powers over their finances.
The weakness is that the information flows to different bodies, in different formats, on different timetables, and mostly after the event. Manchester City’s case with UEFA showed the cost. When the Court of Arbitration for Sport overturned City’s ban in 2020, it found several allegations time-barred, because they concerned events too long before the case was opened, and upheld one finding against the club: that it had failed to cooperate. The Premier League’s own case took even longer. Its investigation began in December 2018; the commission’s decision was published only in September 2026, nearly eight years later, and it upheld three of the four charges that City had failed to cooperate, finding that the club had tried to stop and frustrate the investigation. The same decision found that City had disguised money from its owner as sponsorship income from Abu Dhabi companies for nine seasons, and that the club’s auditors and football’s regulators remained unaware of it for many years. Under today’s system, time is on the side of a club that does not cooperate, and a scheme that nobody is looking for can run for a decade.
I would join the pieces up:
- A register of what every club owes every other, with the dates each instalment falls due, and of every instalment a club has sold to a lender. Quinn has proposed exactly this, with quarterly returns and a published summary.
- One standard format for every club’s accounts, separating squad costs, owner-linked income and agents’ fees, so that the regulator can compare all 20 clubs automatically.
- Transfer and agents’ payments routed through a clearing house, as FIFA already does for training payments, so that money is visible when it moves, not years later.
- A register of every company linked to a club’s owner, with every sponsorship from those companies benchmarked each year against comparable deals by statistical and AI tools, and outliers flagged at once.
- Shared information between the Premier League, UEFA and the regulator, so that the same deal is not investigated three times.
- Deadlines with automatic consequences. A club that fails to provide information on time should lose registrations or points straight away, not face a separate charge years later, and complex financial cases should have longer time limits so that delay does not pay.
This does not mean publishing every contract. Banking offers the model: the regulator sees everything, the public sees a standard summary. Monitoring of this kind builds trust in both directions. Clubs that keep to the rules know rivals cannot quietly break them, investors can rely on the figures, and supporters get rulings in months rather than a decade of legal argument.
The lesson from Formula 1
Formula 1 faced a similar problem and addressed it with a package of reforms.
From 2014 to 2021, Mercedes won eight constructors’ championships in a row. Money was a large part of the reason. In 2019, Mercedes spent about $484m and finished first; Williams spent about $141m and finished last. Results largely followed the budget, and the smaller teams depended on their owners’ willingness to keep funding losses.
The audience noticed. Red Bull won four titles in a row from 2010 to 2013, and Mercedes’ run followed straight after. Over that period, F1’s worldwide television audience, measured as viewers who watched at least 15 minutes of racing in a season, fell from about 600 million in 2008 to 425 million in 2014 and 352 million in 2017, the lowest in a decade. Much of that fall had nothing to do with the racing: the sport’s own management attributed it largely to moving races from free-to-air to pay television. But one-sided seasons were a contributor. In Britain, where audiences are measured race by race, they dropped in the seasons when one driver or team was running away with it: in 2013, during Sebastian Vettel’s run of wins, and again in 2015, when Mercedes dominated. A sport in which the same team wins every year gives its casual viewers one more reason to switch off.
F1 changed that with three measures that worked together:
- A cost cap. From 2021, each team’s spending was capped at $145m, falling to $135m for 2023 to 2025. For 2026 the nominal cap rose to $215m, because more categories of spending were brought inside it, so the higher figure is not directly comparable with the old $135m limit.
- Fairer shares of the sport’s income. A new commercial agreement shared F1’s revenue more evenly between the teams.
- New technical rules from 2022, designed to let cars follow each other and race more closely.
Since the cap arrived, the constructors’ title has gone to three different teams: Mercedes in 2021, Red Bull in 2022 and 2023, and McLaren in 2024 and 2025.
The cap limits the team, not the drivers. It covers what it costs to design, build and run the car: most staff salaries, parts, development and transport. It does not cover the drivers’ pay, the pay of the team’s three highest-paid staff, marketing or travel. A team can still pay its star driver whatever it chooses; what it cannot do is outspend everyone else on the car.
That is the key difference from football, and it shapes my proposal. In football, the players are both the car and the driver. There is no way to limit spending on the squad without affecting what players are paid. That is why I would not copy F1’s fixed cap. A fixed number is what the players’ union fought when anchoring was proposed, as Part 4 described. My proposal limits the share of each club’s own revenue that can go on the squad, so a club that earns more can still pay more.
F1 also did something cleverer, and that is where the rest of my proposal comes from. Wind-tunnel and simulation time, the scarce resource for developing a car, is shared out on a sliding scale by championship position. The champions receive 70% of the base allocation; the last-placed team receives 115%. When Red Bull broke the cost cap in 2021, the penalty included a further 10% cut in that testing time, which Red Bull’s team principal described as the more draconian part of the sanction.
Football does the opposite. Prize money rises with league position, European qualification adds more, and the SCR turns that extra revenue into extra spending room. F1 gives its weakest team the most development time. The Premier League gives its strongest team the most spending room. My proposal treats the SCR as football’s wind tunnel: the strongest clubs get the least allowance, and the clubs trying to climb get the most.
The result in F1 is the part football should notice. According to Forbes, the average F1 team was worth about $500m in 2019. By 2025 it was worth about $3.6bn, and Forbes attributes most of the rise to the profitability that followed the cost cap: team values went from about 2.3 times revenue to about 8 times. The Williams team was sold for about $180m in 2020; Forbes now values it at around $2.5bn. The cost cap was one part of that transformation, alongside rapid commercial growth, a much larger audience in the United States, a closed grid of ten or eleven teams and a more valuable global media product. But profit is the part football can control. A business that makes a profit is worth more than one that does not, and it attracts outside investment rather than depending on one owner’s willingness to cover losses.
What it would mean for each club
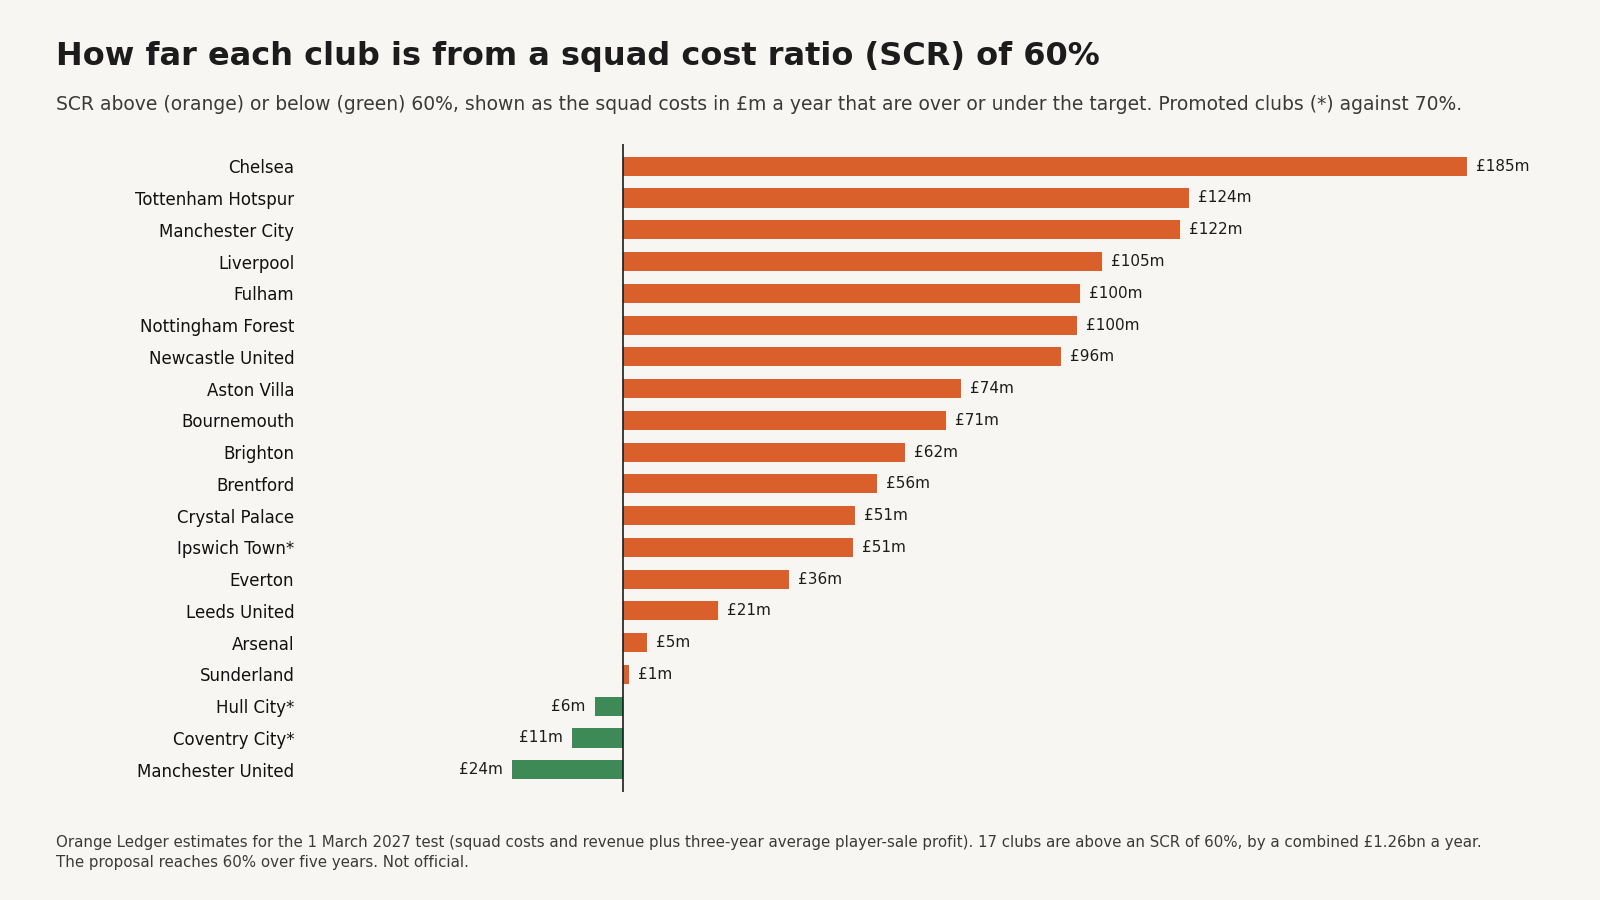
On the Orange Ledger’s estimates for the first test in March 2027, 17 clubs are above an SCR of 60% (or 70% for the newly promoted), by a combined £1.26bn a year. Chelsea have the furthest to go, about £185m a year, followed by Tottenham and Manchester City. Manchester United are already inside the target; Arsenal are just above it, by about £5m a year.
That is a large adjustment, and it is why the transition takes five years. The £1.26bn is not a bill for immediate cost cuts. It is today’s annual gap, and it can be closed by a mixture of lower costs and higher revenue over the transition:
- Revenue growth raises each club’s allowance on its own. The league’s revenue grew by 39% in the last five seasons.
- Expiring contracts bring wages down as players leave or re-sign on new terms.
- Transfer costs roll off. Each signing’s fee is spread over his contract, capped at five years for contracts signed or extended since 12 December 2023, so the cost of today’s squad falls away as contracts run down, unless new signings replace it.
- Selling players removes their future transfer costs as well as bringing in profit.
Over five years, most of a squad turns over anyway. For Chelsea, the £185m gap is about a third of the club’s current squad costs, to be closed across five seasons of contracts ending, signings being written off and revenue growing.
The objections, and my answers
“It will cut players’ wages.” In the short term, yes: it will slow the growth of wages and transfer fees. That is the point: at an SCR of 85%, almost every new pound of revenue can go on the squad. But the players’ union should weigh that against what the current system risks. Players are among the first to suffer when an over-stretched club fails. Portsmouth’s players went unpaid in 2009 and 2010, and Sheffield Wednesday paid its players late repeatedly before going into administration in 2025. A league full of clubs running close to the limit, and owing each other billions, puts every contract in the chain at risk. An SCR of 60%, or even 55%, builds predictability and takes risk out of the system. That in turn makes clubs worth investing in for the long term, and a growing, profitable league is what raises the wage base sustainably over time. Unlike the anchoring cap that the union opposed in Part 4, this is still a share of each club’s own revenue, not one common cash ceiling, and a club that earns more can still pay more. That does not remove the risk of a challenge from the union, particularly as the percentage tightens.
“English clubs will fall behind in Europe.” A top-five English club at an SCR of 50% would face a tighter percentage than a European rival at UEFA’s 70% SCR limit. But English clubs earn far more than most of their rivals, so a lower percentage of a larger revenue still buys a strong squad. The squeeze starts only in year 4, and it moves by 2 points a year, so no club falls off a cliff.
“Clubs will inflate their revenue.” This is the real weakness of any rule based on revenue, as Parts 1 and 2 showed: a club that can inflate its income inflates its limit. That is why monitoring is the fourth part of the proposal, not an afterthought. Deals benchmarked every year, and payments visible as they happen, leave far less room to inflate income than a case brought a decade later.
“It protects the big clubs.” It does the opposite of what anchoring would have done. Anchoring would have set one fixed ceiling. This keeps each club’s limit tied to its own revenue, gives promoted clubs 10 extra points, and squeezes only the clubs that stay at the top.
“It will kill the clubs that live by trading players.” It will not. Profit from selling players still counts towards a club’s revenue, averaged over the last six transfer windows, about three years, exactly as it does today. Clubs such as Brighton, Brentford and Bournemouth, which have built their models on buying well, developing players and selling them on, can keep doing so. That trade is itself a form of redistribution: money flows from the clubs that can afford the highest fees to the clubs that develop the players, and further down the pyramid too. Championship clubs made a net surplus of about £172m from transfers this summer alone. What changes is the role trading plays. Today, for some clubs it is a survival strategy: their squads cost more than their revenue before any sale profit is counted. Chelsea’s underlying SCR, without player-sale profit, is roughly 115%, and Fulham (102.7%) and Nottingham Forest (97.4%) are both close to or above 100% even after player-sale profit is counted. A club in that position has to sell every year just to stay inside the rule, and is badly exposed if transfer prices fall. Bringing the underlying SCR down makes player trading safer, not smaller: sales become a source of profit and extra room, rather than the thing that keeps a club compliant.
“Owners will just pocket the money.” Some of the money a club no longer spends on its squad will go elsewhere, and that is partly the point. It pays for stadiums, academies, women’s football, the staff who are not players, debt reduction, cash reserves and tax: the rest of a football business, which today is squeezed by squad costs. And sometimes an owner will take a return. A football club that can pay its owner a return without weakening itself is not a failure of regulation. It is exactly the kind of business that attracts investment.
The price of this proposal
There is a real downside, and I should be clear about it. Under the rule I am proposing, no owner could buy a title in three transfer windows.
The route Roman Abramovich took at Chelsea, and Sheikh Mansour at Manchester City, would be closed. An investor with grand plans could no longer arrive, spend whatever it takes for three seasons and turn a mid-table club into champions. Owner money could build a stadium, an academy and a training ground, and it could support a promoted club through its first seasons. It could not buy the squad.
The only route left is the long one: grow the revenue, develop and sell players well, build the commercial base, and climb over years rather than transfer windows. Some investors will not want that, and some supporters will miss the chance of a sudden transformation. I think that is a price worth paying for a league whose clubs are still standing when the revenue stops growing. But it is a price.
It is also worth remembering how state money behaves in sport. It arrives in a flood and can leave just as fast:
- China. In the mid-2010s, Chinese Super League clubs spent heavily to bring in players from Europe. Government policy then turned against the spending, tighter controls followed, and Jiangsu folded months after winning the 2020 title.
- Golf. Saudi Arabia’s Public Investment Fund spent more than $5bn building the LIV Golf tour, then announced in April 2026 that it would stop funding it after this season, saying the investment no longer fitted its strategy.
- Saudi football. The Saudi Pro League’s spending spree from 2023 added to the pressure on fees and wages across Europe. In 2026, the budgets of the fund’s clubs were reported to have been reduced.
Each was a spike, not a foundation. A league whose clubs depend on a few owners willing to lose money is exposed to the moment those owners change their minds.
Clubs with big ambitions, such as Aston Villa and Newcastle United, have argued that the financial rules hold them back and protect the established clubs; both pushed for a looser limit under PSR. Under my proposal they would have to grow within their means. But they would find the established clubs held back too: the averaged top five would face the tightest SCR of all. Their owners’ money would go where it builds lasting value, into stadiums, training grounds and academies. And they would be protected from the wage and transfer inflation that an Abramovich-style owner brings to everyone else’s costs. In the long run, that is a better deal for an ambitious club than a rule that lets the richest owner set the price of every player.
Why this matters
The Premier League is the richest league in the world, and it still loses almost £1bn a year. That is not a sign of strength. It is a sign that every pound of growth has been spent before it arrives. A limit that lets clubs make a profit would make them worth more, attract investment on better terms than an owner covering losses, and protect the clubs, players and supporters when the revenue stops growing, as it always eventually does.
The rule I have described deals with the Premier League. The hardest part of English football’s finances is what happens to a club when it falls out of it. That is Part 6.
Next in the seriesPart 6: the drop into the Championship
Sources and caveats.
This is an opinion piece. The proposal and the arguments for it are the author's view. The facts behind them are sourced below.
Premier League finances. Deloitte, Annual Review of Football Finance: pre-tax losses from the 2026 edition (Chart 9) for 2020/21 (£707m), 2021/22 (£601m), 2022/23 (£683m), 2023/24 (£135m) and 2024/25 (£948m); revenue from the 2022 to 2026 editions (£4.9bn, £5.5bn, £6.1bn, £6.3bn, £6.8bn). The losses for 2020/21 to 2022/23 were first printed from earlier editions, 2022/23 as reported by SportsPro citing Deloitte (see the correction of 21 October 2026); for 2024/25 also wages of £4.4bn (65% of revenue) and operating profit of £263m. 2020/21 figures include the effects of Covid. Other operating costs are derived by the Orange Ledger as revenue less wages less operating profit.
The break-even estimate. The Orange Ledger's indicative estimate of a sustainable squad cost share of roughly 56% to 62% assumes that staff other than players and the head coach account for between 10% and 20% of the wage bill, a range not published by Deloitte. It is before profit on player sales and before interest, and it is a league-wide estimate, not a figure for any one club; clubs' commercial, stadium, interest and depreciation costs differ widely.
Clubs. Manchester United's cash shortfalls and job cuts from the Orange Ledger's United article and its sources. Arsenal: the Telegraph (12 September 2026) on staff fears of job cuts and the review by Boston Consulting Group, and the Telegraph's Sam Dean on seven consecutive years of losses in the club's accounts. UEFA's European club talent and competition landscape report (September 2026) as reported by Inside World Football, including the 35 transfers above €50m in summer 2026. The £3.48bn gross commitment in summer 2026 from Sky Sports' transfer data as used by Paul Quinn (The Esk, 3 September 2026).
Formula 1. Cost cap figures and exclusions as set out by Formula1.com, Motorsport.com, Motor Sport Magazine and formulaonehistory.com; the three-part package (cost cap, revenue sharing, 2022 technical rules) as described by Motor Sport Magazine; 2019 spending by Mercedes and Williams as reported by Norton Rose Fulbright (2023); the testing scale and Red Bull's 2021 penalty as reported by Jalopnik, Crash.net, Motorsport.com and Sky Sports (2022-23); team values from Forbes (November 2025) and as reported by RacingNews365 (2023) and Autosport (2026). Worldwide TV audience figures from Formula One Management's annual global media reports as reported by RaceFans (April 2016), Forbes (February 2015) and Formulapedia (2023); the attribution of the decline to pay television by Bernie Ecclestone as reported by Forbes (2015); British audiences in 2013 and 2015 from overnight viewing figures analysed by Motorsport Broadcasting (December 2015).
Inter-club debt and borrowing. Paul Quinn, The Esk, "The Analysis Series: Systemic risk; football's shadow credit market" (3 September 2026), for transfer payables and receivables at 30 June 2025 (from aggregations of the clubs' filed accounts by Matchday Finance and Greg Cordell), instalments due in 2025/26, operating cash flow, the share of summer 2026 spending between Premier League clubs, his modelled estimates to 2027, the Championship's net transfer surplus in summer 2026 (from Sky Sports' transfer data), receivables financing, the Morgan Rogers payment chain, Sheffield Wednesday's administration and his recommended register. Borrowing rates from Quinn's analyses of lenders to Premier League clubs (The Esk, 2025), including Everton's historical rates and the Southampton and West Ham loans also reported by Front Office Sports (2021).
State money in sport. PIF's decision to end LIV Golf funding after the 2026 season, and its total investment of more than $5bn, as reported by AFP, ABC News and Golf Monthly (30 April to 1 May 2026). The reported reduction in Saudi Pro League club budgets in 2026 as reported by vision2030.ai (July 2026), citing press reports. The Chinese Super League's spending and subsequent controls, and Jiangsu's dissolution after the 2020 title, as widely reported at the time. Aston Villa and Newcastle United's push for a higher PSR threshold as reported by Goal (2025).
Monitoring. FIFA on its Transfer Matching System and on the Clearing House, which began operating on 16 November 2022; the Clearing House's status and the increase in training payments as reported by The Ball Business (2026) and LawInSport (2024), which also notes delays in its early operation. The Premier League's fair-market-value checks and SCR monitoring dates from its explainer (July 2026). The CAS award of 13 July 2020 as described in Part 1 and its sources. The Premier League's case against Manchester City from the independent commission's redacted core decision and the League's statement (both 29 September 2026), including the start of the investigation in December 2018, the non-cooperation findings and the finding that auditors and regulators were unaware of the scheme. The proposals in this section are the author's.
Orange Ledger estimates. Squad costs, revenue and squad cost ratios are the Orange Ledger's independent estimates for the 1 March 2027 test, published in the SCR table and club reconstructions. Gaps are measured against an SCR of 60%, and against 70% for Coventry City, Hull City and Ipswich Town as newly promoted clubs. They are not official.
The full source register for this series is held with the Orange Engine.
Corrections and updates (17)
5 October 2026 · Methodology change · several figures: see the note
Update, 5 October 2026. Manchester United’s ratio is now 59.0%, from 58.8%, Arsenal’s is now 60.7%, from 60.4%, Chelsea’s is now 94.3%, from 94.0%, Fulham’s is now 106.4%, from 106.0%, and Nottingham Forest’s is now 103.4%, from 102.5%, after contract lengths were measured from their dates and, at Brighton, Ipswich Town, Newcastle and Manchester City, the revenue the rule counts was read from the group’s accounts (the engine changelog). Bournemouth’s central estimate is now 85.5%, from 85.2%, in a range of 80.1% to 87.7%, with about 38% of the modelled outcomes above the 85% line, from about 34%: the estimate does not reliably tell which side of the line the club is on. Chelsea’s averaged player-sale profit is now about £109m a year, from about £108m, and without it the squad would cost roughly 117% of revenue, from roughly 116%. The 17 clubs above an SCR of 60% are now above it by a combined £1.33bn a year, from £1.31bn: Chelsea by about £193m, from about £191m, Tottenham by £131m, from £129m, Nottingham Forest by £113m, from £110m, Liverpool by £108m, from £107m, Fulham by £108m, from £107m, Aston Villa by £81m, from £80m, Bournemouth by £71m, from £70m, Brighton by £62m, from £63m, Brentford by £60m, from £59m, Crystal Palace by £51m, from £50m, Ipswich Town by £47m, from £45m, Everton by £38m, from £37m, Leeds by £19m, from £18m, and Arsenal by about £6m, from about £3m. Manchester City’s gap is unchanged at £131m and Newcastle’s at £103m. Below the target, Hull City are now £5m under, from £6m, Manchester United £8m, from £9m, and Coventry City £10m, from £11m.
5 October 2026 · Regulatory interpretation · several figures: see the note
Update, 5 October 2026. Manchester United’s ratio is now 57.3%, from 59.0%, and the club is now £21m under an SCR of 60%, from £8m, after the estimate was built on the accounts of the group the rule describes, where it had been built on the club company’s (the engine changelog). The chart is redrawn.
7 October 2026 · New evidence · several figures: see the note
Update, 7 October 2026. Fulham’s ratio is now 104.0%, from 106.4%, and Chelsea’s is now 93.2%, from 94.3%, after each club’s inputs were checked against its own announcements, the League’s squad lists and its filed accounts (the engine changelog). Bournemouth’s central estimate is unchanged at 85.5%, in a range of 80.1% to 87.7%, with about 37% of the modelled outcomes above the 85% line, from about 38%: the estimate does not reliably tell which side of the line the club is on. Without its averaged player-sale profit Chelsea’s squad would now cost roughly 116% of revenue, from roughly 117%. The 17 clubs above an SCR of 60% are now above it by a combined £1.32bn a year, from £1.33bn: Chelsea by about £187m, from about £193m, Manchester City by £129m, from £131m, Fulham by £102m, from £108m, Brighton by £64m, from £62m, and Crystal Palace by £52m, from £51m. Tottenham’s gap, unchanged at £131m, is now the second largest, ahead of Manchester City’s. Below the target, Coventry City are now £9m under, from £10m. The chart is redrawn.
7 October 2026 (second) · Regulatory interpretation · several figures: see the note
Correction, 7 October 2026, second correction of the day. Arsenal’s ratio is now 59.5%, from 60.7%, so the club is now below an SCR of 60%, by about £4m a year, where it had been about £6m above it. There are now 16 clubs above an SCR of 60% (or 70% for the newly promoted), by a combined £1.31bn a year, from 17 clubs and £1.32bn: Manchester City by £127m, from £129m, and Brighton by £63m, from £64m. The three clubs’ revenue under the rule is higher after the European home matches the rule counts were corrected: seven for Arsenal and five for Manchester City, where we had counted four at each, and four for Brighton, where we had counted three (how we count matchday revenue). The chart is redrawn.
9 October 2026 · Methodology change · several figures: see the note
Correction, 9 October 2026. Last season’s commercial revenue, which 19 clubs have not yet filed, is now estimated by one published method for every club, where each figure had been a judgement of ours (how we estimate last season’s commercial revenue); Sunderland’s and Ipswich Town’s estimates are provisional. Arsenal’s ratio is now 59.9%, from 59.5%, and the club is now about £1m a year below an SCR of 60%, from about £4m. Chelsea’s ratio is now 92.5%, from 93.2%, and without its averaged player-sale profit the squad would cost roughly 114% of revenue, from roughly 116%. Fulham’s ratio is now 102.7%, from 104.0%, and Nottingham Forest’s is now 102.3%, from 103.4%. Bournemouth’s central estimate is unchanged at 85.5%, in a range of 79.5% to 87.8%, from 80.1% to 87.7%, with about 35% of the modelled outcomes above the 85% line, from about 37%: the estimate does not reliably tell which side of the line the club is on. The 16 clubs above an SCR of 60% (or 70% for the newly promoted) are now above it by a combined £1.28bn a year, from £1.31bn: Chelsea by about £185m, from about £187m, Tottenham by £123m, from £131m, Manchester City by £116m, from £127m, Nottingham Forest by £111m, from £113m, Newcastle by £105m, from £103m, Liverpool by £101m, from £108m, Fulham by £100m, from £102m, Aston Villa by £87m, from £81m, Brighton by £62m, from £63m, Brentford by £59m, from £60m, Crystal Palace by £51m, from £52m, Ipswich Town by £49m, from £47m, Leeds by £22m, from £19m, and Sunderland by £2m, from £8m. Bournemouth’s gap is unchanged at £71m and Everton’s at £38m. Newcastle’s gap is now larger than Liverpool’s. This article said that four more clubs sit between 79% and 85%; it now says that four more clubs’ central estimates sit there, and gives the range of the three whose range runs above the line. The chart is redrawn.
15 October 2026 · Editorial · several figures: see the note
Clarification, 15 October 2026. Wording only; no figure changed. The ranges quoted in this article are assumption ranges, the spread of the model’s inputs between assumed bounds, not calibrated or confidence intervals, and the shares of modelled outcomes above the 85% line quoted in the notes above are withdrawn.
15 October 2026 (second) · New evidence · several figures: see the note
Update, 15 October 2026, second correction of the day. Everton are now £39m above an SCR of 60%, from £38m, and Newcastle’s central estimate is 84.9%, from 84.7%, in an assumption range of 79.1% to 88.8%, from 78.9% to 88.6%, still spanning the 85% line, after corrections to both clubs’ figures (the engine changelog). The chart is redrawn. The argument does not change.
16 October 2026 · Assumption revision · several figures: see the note
Updated 16 October 2026: loans out now recorded; wage relief shown in ranges. Every club’s players out on loan are now recorded; where nobody says how much of a loaned player’s wage the borrowing club pays, the possible saving widens the assumption range and leaves the central figure where it is (the engine changelog). Arsenal’s ratio is now 60.1%, from 59.9%, so the club is now above an SCR of 60%, by about £1m a year, where it had been about £1m below it. There are now 17 clubs above an SCR of 60% (or 70% for the newly promoted), by a combined £1.27bn a year, from 16 clubs and £1.28bn: Nottingham Forest by £103m, from £111m, and Liverpool by £100m, from £101m. Manchester United’s ratio is now 56.9%, from 57.3%, £24m under an SCR of 60%, from £21m. Chelsea’s central estimate is unchanged at 92.5%, but its assumption range is now 83.0% to 97.2%, from 86.6% to 98.6%, and reaches below 85%: this article had counted Chelsea among the clubs clearly above that line, and now does not. Bournemouth’s range is 79.0% to 87.6%, Brentford’s 77.3% to 87.1% and Tottenham’s 76.6% to 85.8%. The chart is redrawn. The argument does not change.
21 October 2026 · Correction · two figures: see the note
Correction, 21 October 2026. The clubs’ combined losses for 2020/21 to 2022/23 came from earlier editions of Deloitte’s Annual Review of Football Finance, one of them as reported by SportsPro. Deloitte’s 2026 edition restates them: 2020/21 is £707m, from £669m; 2021/22 £601m, from £607m; 2022/23 £683m, from £685m. The five-season total is £3.1bn, from £3.0bn. 2023/24 and 2024/25 are unchanged, and so is the argument. The chart is redrawn.
23 October 2026 · Methodology change · several figures: see the note
Correction, 23 October 2026. The figures this article gives for each club, and the chart of how far each is from an SCR of 60%, rested on two readings of the rule we have since corrected, and are restated. Rule A.1.53 averages the profit on player sales over the six most recent transfer windows, which for the March 2027 test begin in February 2024; we had averaged three financial years. Rule A.1.22(c) caps the spreading of a transfer fee at five years for any contract signed since 12 December 2023, and we had not applied the cap to registrations already in clubs’ filed book values. The article had kept its earlier figures when the first of those corrections was made.
- The gap to 60%: 17 clubs are above it, as before, by a combined £1.23bn a year, from £1.27bn. Chelsea are £173m above, from £185m; Tottenham £125m, from £123m; Manchester City £117m, from £116m; Newcastle £94m, from £105m; Nottingham Forest £100m, from £103m; Aston Villa £74m, from £87m; Everton £36m, from £39m; Brentford £57m, from £59m; Crystal Palace £50m, from £51m; Leeds £21m, from £22m. The chart is redrawn.
- Around the 85% line: Chelsea’s central estimate is 89.1%, from 92.5%, in a range of 80.2% to 93.5%, and it rests on £134m a year of sale profit, from £109m. Newcastle’s is 81.3%, from 84.9%, and its range, 75.9% to 85.0%, no longer spans the line, so the clubs whose range spans it are two of four, from three: Brentford at 82.3%, from 83.8%, and Tottenham at 80.9%, from 80.4%.
- The argument does not change. See the engine changelog.
- Also corrected: in the answer to the first objection, Chelsea’s figure without player-sale profit is roughly 115%, from 114%, and Nottingham Forest’s ratio 97.6%, from 102.3%.
24 October 2026 · Methodology change · no figure changed
Correction, 24 October 2026. No figure changed. This article said the rule averages profit on player sales over the last three years. It takes the profit or loss on sales in the six most recent transfer windows and divides it by three (Rules A.1.13 and A.1.53). Six windows cover about three years, but a club’s sales from February to the end of its financial year fall in a later window than the rest of that year, so they stay in the average for one test longer. The sentence now says six transfer windows. The figures in this article already count sales by window. The note of 23 October above says that Chelsea’s and Nottingham Forest’s corrected figures are in the answer to the first objection; they are in the answer to the fifth, “It will kill the clubs that live by trading players”, which is also the passage corrected here.
25 October 2026 · Data correction · no figure changed
Correction, 25 October 2026. No figure changed. The note of 23 October gave new central estimates and ranges without the ranges they replaced: Chelsea’s range is 80.2% to 93.5%, from 83.0% to 97.2%; Brentford’s 76.0% to 85.4%, from 77.3% to 87.1%; and Tottenham’s 77.0% to 86.4%, from 76.6% to 85.8%. The paragraph on the clubs near the line said four clubs sit between 79% and 85% and named three; the fourth is Brighton, at 79.1%, and it is now named. The Telegraph’s report was of 12 September, not of this article’s month. And the £3.48bn of transfer fees is Sky Sports’ count, beside UEFA’s €4.6bn for the same summer; the sentence now names whose figure it is.
26 October 2026 · Regulatory interpretation · several figures: see the note
Correction, 26 October 2026. Fees paid and received for head coaches now count, and filed loan income is in the ranges. A fee one club pays another for a head coach is part of the squad cost, spread over his contract (Rule A.1.22(d)); compensation a club receives for releasing one counts with the profit on player sales (Rule A.1.29(g)). We had counted neither. Fees received for lending players count with the profit on player sales (the guidance to Rule A.1.29(g)); the accounts do not split them from wages recharged, so they widen the range and leave the central figures alone. Chelsea’s ratio is 88.3%, from 89.1%, in a range of 79.4% to 92.6%, from 80.2% to 93.5%; Bournemouth’s range is 78.4% to 87.0%, from 79.0% to 87.6%; Brentford’s ratio is 81.6%, from 82.3%, in a range of 75.3% to 84.7%, from 76.0% to 85.4%; Newcastle’s is 81.7%, from 81.3%, and the top of its range, 85.5%, is now just above the line, where it was just below, so Newcastle, not Brentford, is now among the clubs the estimate cannot place either side of the line. The distances above a 60% target move with them: Chelsea’s is about £169m a year, from £173m; Manchester City’s £122m, from £117m; Newcastle’s £96m, from £94m; Brentford’s £56m, from £57m; Crystal Palace’s £51m, from £50m; Ipswich’s £51m against 70%, from £49m; and the seventeen clubs’ combined £1.24bn, from £1.23bn.
28 October 2026 · Data correction · several figures: see the note
Correction, 28 October 2026. We checked every transfer in our records against published sources and corrected sixteen entries at eleven clubs where the club’s announcement or a reputable report, read on the page, gives a different fee, contract length or date. Arsenal’s ratio is 60.7%, from 60.1%; Chelsea’s 88.6%, from 88.3%, in a range of 79.7% to 92.9%, from 79.4% to 92.6%; Bournemouth’s 85.4%, from 85.5%, in a range of 78.3% to 86.9%, from 78.4% to 87.0%; Tottenham’s 81.0%, from 80.9%, in a range of 77.1% to 86.5%, from 77.0% to 86.4%; Nottingham Forest’s 97.4%, from 97.6%. Chelsea’s distance above a 60% target is about £171m a year, from £169m.
31 October 2026 · Data correction · several figures: see the note
Correction, 31 October 2026. Chelsea’s ratio is 92.3%, from 88.6%. Bashir Humphreys and Kepa Arrizabalaga were counted twice, in 2024/25 by the accounts and in 2025/26 by us, and summer 2025 sale profit is now anchored to note 30 of the accounts of Chelsea FC Holdings: £31.8m, where we had modelled £82.4m. The assumption range is 82.9% to 96.8%, from 79.7% to 92.9%. Clubs above an SCR of 60% are over by £1.26bn in total, from £1.24bn; Chelsea by £185m, from £171m; Liverpool by £105m, from £100m; Tottenham by £124m, from £125m. Tottenham’s ratio is 80.9%, from 81.0%, in a range of 77.0% to 86.4%, from 77.1% to 86.5%, and the low end of Brighton’s range is 70.8%, from 70.7%. Figures that follow from these are restated with them in the text. The correction does not reverse the article’s conclusion.
3 November 2026 · Data correction · no change to the estimates
Correction, 3 November 2026. The estimates and the chart are unchanged; three figures in the text and the chart’s description had not kept up with them. The paragraph after the club figures called the combined gap £1.23bn, from the note of 23 October; it is £1.26bn, as the paragraph before it says. Arsenal are about £5m a year above an SCR of 60%, from about £1m: the corrections of 28 October moved Arsenal’s ratio to 60.7% without restating this figure. The chart’s description gave Chelsea’s gap as £169m, from the note of 26 October; it is £185m, as the chart and the text say. It also gave Sunderland £2m above, Hull City £5m below and Coventry City £9m below; the chart shows £1m, £6m and £11m, the figures of the same release. The sentence on transfer costs said every fee is spread over at most five years; the cap applies to contracts signed or extended since 12 December 2023, and older contracts run their full term.
3 November 2026 (second) · Editorial · no figure changed
Correction, 3 November 2026, second of the day. No figure changed. Four statements are made more precise. 60%: the article called its 56% to 62% of revenue “an SCR of around 60%”. The SCR also counts averaged profit on player sales in its base, so the two are not the same; 60% is now described as the proposal’s starting point, to be tested against whether clubs make a profit, not as a proven break-even level. The players’ union: the article said the union accepted the SCR. We have found no evidence that it endorsed the SCR, only that it opposed anchoring; the sentence now says the proposal is a share of each club’s revenue, not a common ceiling, and that a challenge remains possible. Gaming the top five: the article said a club gains nothing by dropping a place deliberately. A club at the edge of the top five could still change its future allowance; the sentence now says the system is hard to game, not that it cannot be. The heading on inter-club debt said no rule measures that risk. The League has powers over overdue transfer fees; what is missing is a central register of what clubs owe each other, which the section goes on to describe.