
Analysis
Under a 50% cap, Manchester City's way out runs through selling Haaland
A hypothetical scenario, not a prediction. What would happen to Manchester City if the squad cost ratio were capped at 50% for five seasons, as Paul Quinn of theesk has proposed? With nobody sold City loses 30 league points in the first season. In our model the only strategy that keeps every point is selling from the top of the squad, starting with Erling Haaland.
Figures as of 26 October 2026, scenario version V2CF · Latest figures · What the engine does not capture
6 October 2026.
Latest change to the figures, 26 October 2026: City’s starting point is 74.4%, from 73.7%, and 86.4% before player trading, from 85.6%; the scenario is rerun. All 8 correction notes are at the end.
On 29 September an independent commission found every charge the Premier League brought against Manchester City proven except one. Its findings cover nine seasons of misstated accounts, from 2009/10 to 2017/18, and later failures to cooperate with the League’s investigation (our account of the decision). City dispute the findings, have appealed (2 October 2026), and say the decision contains errors of law, principle and fact. No sanction has been set: that is for a separate, private hearing, and the League’s rules allow fines, points deductions and other sporting sanctions.
Paul Quinn put a question to us. The Premier League now limits what a club may spend on its squad to 85% of its income. What if City were held to a hard cap of 50% for five seasons?
The answer, in three sentences:
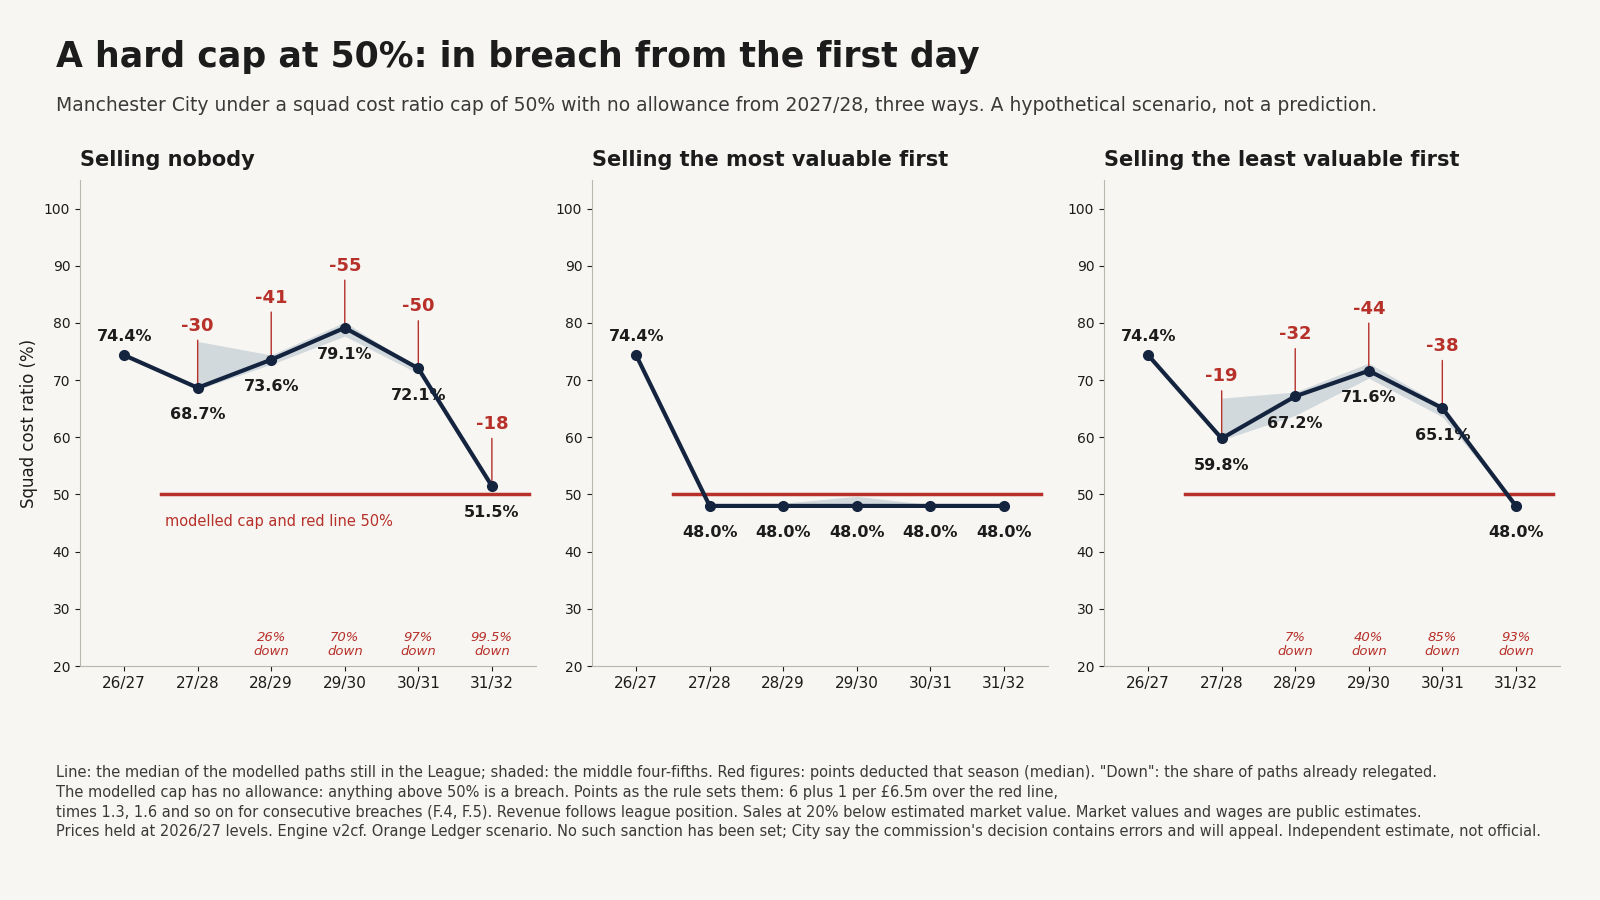
- City would be in breach from the first day: with nobody sold it loses 30 league points in the first season, and is relegated within five seasons in 99.5% of the runs we modelled. That share, like every share of runs in this article, is a conditional scenario frequency: a share of the scenario’s simulated runs under its stated assumptions, not a real-world probability.
- In our model, the only one of three strategies that keeps every point is selling from the top of the squad, starting with Erling Haaland: four players in one summer, two of them at a loss.
- That cuts the share of runs ending in a top-four finish from 69% to 41% at once, under our deliberately simple spending-to-points model.
This scenario was suggested by Paul Quinn of theesk. In his proposal for settling the case, published on 3 October, he argues that City’s advantage was regulatory headroom rather than cash, so the fitting sanction is to take that headroom back: a 50% squad cost cap for five seasons, which he estimates removes about £883m of spending power against UEFA’s 70% limit, close to the £921m misstatement the Commission identified, alongside a £300m compensation fund. We asked what such a cap would do to City, season by season. We model the cap within the rule’s existing definitions; Paul’s proposal adds further terms, including a limit of £40m a year on the player-sale profit that counts, which would make the cap tighter still.
We also ran a second scenario: the same 50% line, but with the room for error the rule normally gives. It ends in much the same place a year or two later, with the forced sales made on better terms.
This is a hypothetical scenario, not a prediction. No such sanction has been set, a squad cost cap is not among the standard sanctions, and City have appealed (2 October 2026).
The rule in plain words
From this season the Premier League tests each club on one number, the squad cost ratio. Our explainer sets it out in full; this is the short form.
What it measures. One figure divided by another.
- On top, what the squad costs in a year: players’ wages, agents’ fees, and the cost of each signing spread over his contract, for at most five years. A player bought for £60m on a five-year contract counts as about £12m a year. That yearly slice is called amortisation, and the part of a fee not yet counted is the player’s book value.
- Underneath, what the club earns from football: broadcasting, matchdays and commercial income, plus the average profit on player sales over the last six transfer windows, about three years.
The 85% line. A club that spends up to 85% of that income on its squad is compliant. Above the line it pays a levy, from 2027/28: the amount of the overspend, multiplied by the number of percentage points it is over.
The allowance, and the red line. League points are not deducted at 85%. Every club starts with an allowance of 30 percentage points above the line, so its red line is 115%. A season above the line uses up allowance equal to the size of the breach, and each season at or below it earns 10 percentage points back.
The points deduction. Above the red line a club loses six league points, plus one more for every £6.5m, or part of it, above the line. A second consecutive breach multiplies the total by 1.3, a third by 1.6, and so on.
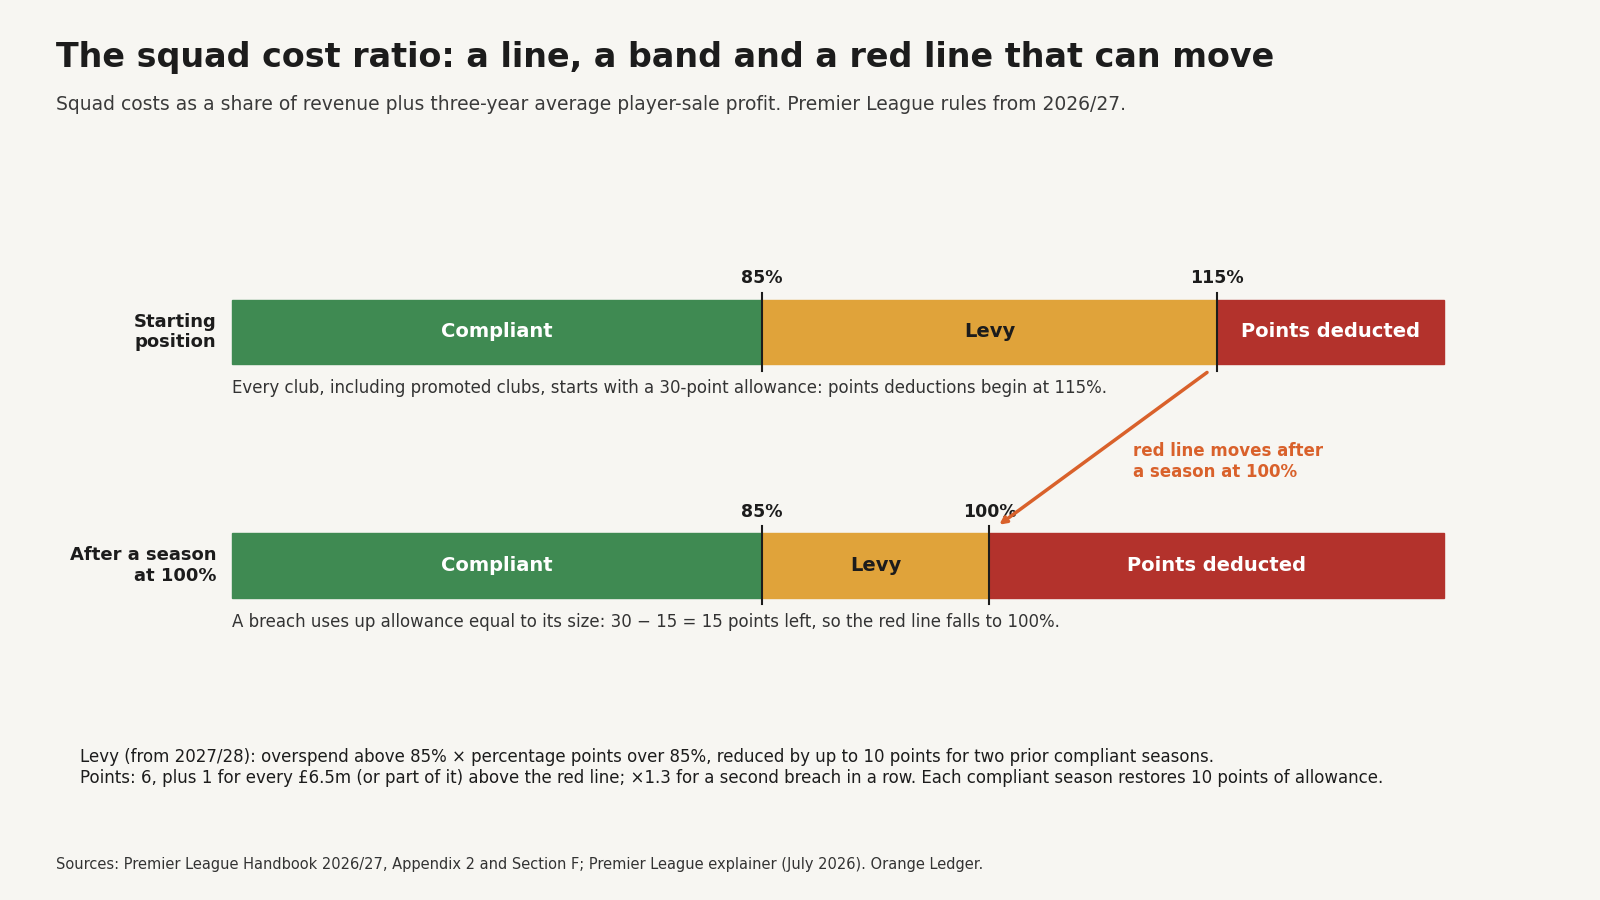
Our two scenarios both put the line at 50% for the five seasons from 2027/28 to 2031/32.
- Scenario 1, the hard cap. No allowance. Anything above 50% is a breach, and league points are counted from the 50% line. This is the question as Paul meant it.
- Scenario 2, the rule as written. The line moves to 50% and everything else stays, including the allowance of 30 percentage points.
Scenario 1: the hard cap
City’s ratio today is 74.4%: a squad costing £633m a year against £733m of football income and £118m of averaged sale profit. Under the normal rule that is 10.6 percentage points inside the 85% line.
By 2027/28 the squad would cost about £557m with nobody sold, because fees paid years ago finish being counted and one sale is already agreed. That is 68.7%, 18.7 percentage points over the cap. Half of City’s income for the test is £406m.
- The gap is £151m. Six league points, plus one for each £6.5m or part of it: 30 in the first season.
- The table would do the rest. With no luck either way, 30 points takes City from third or fourth to somewhere between 13th and 17th, depending on which season’s table its points are set against, and out of Europe.
- Then the cap itself shrinks. The Champions League is worth £98m of the income the rule counts. Without it City’s football income falls to about £620m and the cap to £338m. The same squad is further over a lower cap: 41 league points in the second season.
Who can be sold at a profit
To get under the cap City has to cut what its squad costs. Selling a player helps twice, or hurts once.
- He stops costing: his wage and his yearly slice of fee come off the squad cost.
- A profit raises the cap. If he sells for more than his book value, the profit is added to City’s income for the test, a third at a time over three seasons.
- A loss lowers it. If he sells for less, the loss comes off in the same way.
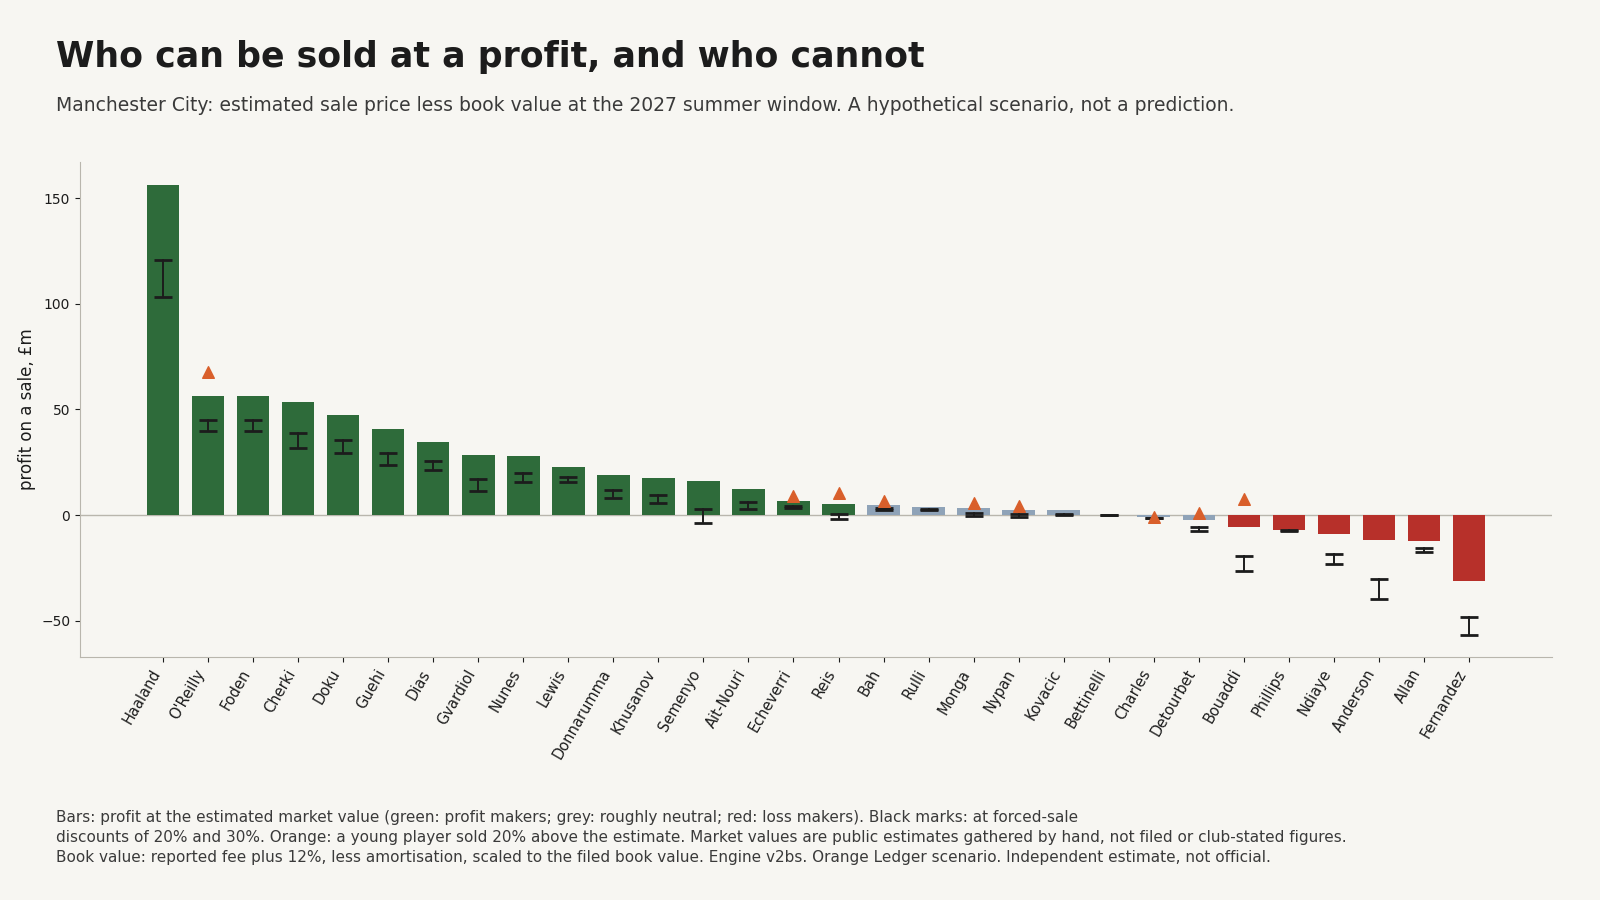
The players whose sale would add most (£m):
| Player | Fee paid | On the books, July 2027 | Estimated value | Profit at that value | Profit at 20% below |
|---|---|---|---|---|---|
| Erling Haaland | 51.2 | 22.5 | 187.1 | 156.4 | 120.8 |
| Nico O’Reilly | 0.0 | 0.0 | 59.5 | 56.5 | 45.2 |
| Phil Foden | 0.0 | 0.0 | 59.5 | 56.5 | 45.2 |
| Rayan Cherki | 30.5 | 20.3 | 76.5 | 53.5 | 38.9 |
| Jeremy Doku | 55.5 | 13.8 | 63.8 | 47.5 | 35.4 |
And those who would be sold at a loss:
| Player | Fee paid | On the books, July 2027 | Estimated value | Profit at that value | Profit at 20% below |
|---|---|---|---|---|---|
| Enzo Fernández | 125.0 | 116.0 | 85.0 | -30.9 | -47.9 |
| Allan | 32.0 | 29.2 | 17.0 | -12.2 | -15.6 |
| Elliot Anderson | 116.0 | 105.2 | 93.5 | -11.7 | -30.4 |
| Iliman Ndiaye | 60.0 | 55.7 | 46.8 | -8.9 | -18.2 |
| Kalvin Phillips | 42.0 | 8.5 | 1.5 | -6.9 | -7.2 |
| Ayyoub Bouaddi | 81.0 | 73.8 | 68.0 | -5.8 | -19.4 |
Haaland is the clearest case: valued at about £187m with only £22m of his 2022 fee still on the books. At the other end are the players City bought in 2026: Enzo Fernández, Allan, Elliot Anderson, Iliman Ndiaye and Ayyoub Bouaddi. Almost all of what they cost is still on the books, and the public estimates of their value are below it.
The values are Transfermarkt’s estimates, not transfer fees. A club known to be selling under pressure would probably get less, so we test every sale at the estimate and at 20% and 30% below it.
Three strategies
We ran three strategies through the five seasons, 20,000 times each. They are illustrative rules, not optimal responses: each sells in a fixed order, and a club planning ahead would do better than any of them. In every run City’s results follow what it spends on wages, with a season’s luck added, and its income follows its results. When City has room under the cap it buys again.
| Under the hard cap | Selling nobody | Selling the most valuable first | Selling the least valuable first |
|---|---|---|---|
| League points deducted in 2027/28 | 30 | 0 | 19 |
| League points deducted over five seasons | 71 | 0 | 92 |
| Relegated within five seasons | 99.5% of runs | 2% | 93% |
| Range of the league points over five seasons | 30 to 126 | 0 | 47 to 132 |
| Players sold in the first summer | 0 | 4 | 12 |
| Top-four finish in 2027/28 | 1% | 41% | 6% |
| Top-four finish in 2031/32 | 0% | 22% | 1% |
- Selling nobody. The deductions come every season and grow, because each breach in a row multiplies the next. Most runs are relegated by the third season.
- Selling the least valuable first. Twelve players leave in one summer and City is still at 59.8%, 9.8 percentage points over the cap. Cheap players are cheap to keep, so selling them saves little: 19 league points in the first season, and relegation in 93% of runs. Over five seasons the middle run loses 92 league points (range 47 to 132), with 40% of runs relegated after two seasons and 93% within five; a relegated run loses no further points. Earlier versions of this article printed 88, then 64 and then 91 for the same figure.
- Selling the most valuable first. Erling Haaland, Elliot Anderson, Enzo Fernández and Rayan Cherki go in the summer of 2027. That takes City under the cap with room to buy again in the same summer, up to 48.0%, 2.0 percentage points under it, and no league points are lost, at any of the sale prices we tested.
Why it takes Haaland, and why 2027 is the worst summer to sell
Take Haaland, sold at 20% below the estimate.
- His wage and yearly fee come off the squad cost: about £42m a year.
- A price of £150m against £22m on the books is a profit of £121m. A third of it, £40m, counts as income in each of three seasons, which at a 50% cap allows £20m more squad cost a year.
No other sale does both on that scale. And his profit has to cover what the others lose.
- Fernández cost £125m in 2026. A year later £116m of that is still on the books. Sold for £68m, City books a loss of £48m; Anderson’s sale loses £30m.
- Selling them still helps, because Fernández alone saves £53m a year. But each loss lowers the cap for three seasons, and City would be taking £68m for a player bought for £125m twelve months earlier.
That is the timing trap. A new signing is worth least to this rule in his first year, when nearly all of his fee is still on the books. The hard cap forces the sale in exactly that year.
After that summer City rebuilds to the cap: about £272m of new signings over the five seasons in the middle run (the table shows each season’s middle run, so its column sums to more), for a squad budget near £323m where today’s costs £633m. The top-four chance settles at 34% in 2028/29 and 22% by 2031/32.
Scenario 2: the same line, with the rule’s allowance
Now give City what every club has under the rule: 30 percentage points of allowance above the line. The modelled red line starts at 80%, and each season above 50% uses the allowance up.
| If City sold nobody | Ratio | Before player trading | Whole percentage points over 50% | Modelled allowance (percentage points) | Modelled red line | League points deducted |
|---|---|---|---|---|---|---|
| 2027/28 | 68.7% | 76.4% | 19 | 30 | 80% | 0 |
| 2028/29 | 63.3% | 68.2% | 13 | 11 | 61% | 9 |
| 2029/30 | 76.3% | 76.7% | 26 | 0 | 50% | 42 |
- 2027/28. The same 68.7%, but 11.3 percentage points inside the modelled red line of 80%. No league points; a levy of £29m.
- 2028/29. That season was 19 whole percentage points over, so 19 of the 30 are gone and the red line is 61%.
- 2029/30. The allowance is exhausted. The red line is the 50% line, as in the hard cap.
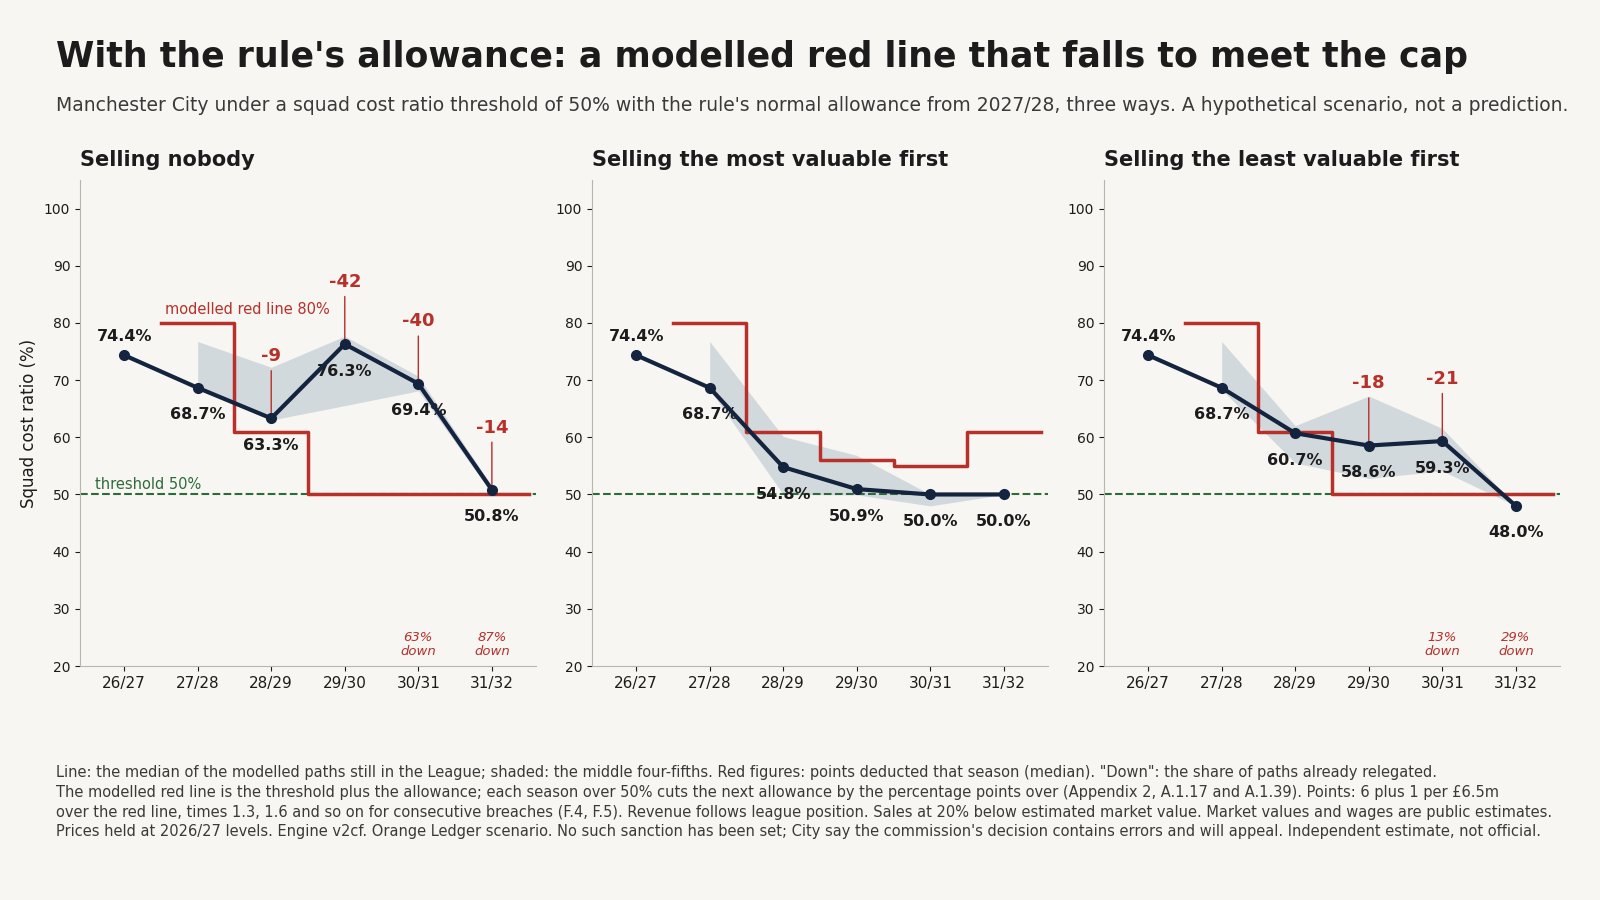
The allowance changes when City has to sell, and how much: the hard cap sells Fernández and Cherki in every run, and with the allowance they are sold in 48% and 3% of runs. Where City ends up is close in both: a top-four chance of 26% in 2031/32, against 22% under the hard cap.
| Selling the most valuable first | Scenario 1: hard cap | Scenario 2: with the allowance |
|---|---|---|
| Players sold in the summer of 2027 | 4 | 0 |
| Haaland sold | 2027 | 2028 |
| Profit or loss on Fernández when sold | -£48m | not sold with no luck either way; sold in 48% of runs |
| Profit or loss on Anderson when sold | -£30m | +£21m |
| Top-four finish in 2027/28 | 41% | 69% |
| Top-four finish in 2028/29 | 34% | 47% |
| Top-four finish in 2031/32 | 22% | 26% |
| League points deducted over five seasons | 0 | 0 |
| Levies paid | £0m | £33m |
- Nothing has to be sold in 2027. Haaland goes a year later, and on his own he is enough for that season.
- Anderson is sold in 2029, not 2027; with no luck either way Fernández is not sold at all. By then two more years of Anderson’s fee have been counted, so the same price books a profit of £21m where the hard cap books a loss of £30m. Fernández is sold in 48% of runs; under the hard cap he is sold in every run. That depends on Anderson’s value holding while City waits, which a club everyone knows must sell cannot count on.
- Selling nobody loses league points in every season from 2028/29: 9 in 2028/29, 42 in 2029/30, and relegation in 87% of runs within five seasons. In the 13% of runs that survive, the ratio falls to 50.8% in the last season, 0.8 percentage points over the line; that fall is largely our assumption that players whose contracts end are replaced at half their cost, not the rule.
- Selling the least valuable first loses league points too: 36 over the five seasons in the middle run (range 25 to 68), with relegation in 29% of runs within five seasons.
What it means
- The hard cap is brutal because it allows no time. Four of City’s most valuable players in one summer, two at a loss, or 30 league points.
- The rule’s allowance buys a season or two, not a different outcome. By 2029/30 the red line is 50% in both scenarios, and City’s top-four chance in 2031/32 is 22% under the hard cap and 26% with the allowance.
- Spending into the allowance is self-defeating. If City used its first-season room to buy, the red line would fall to 52% a year later where it otherwise falls to 61%, and selling nobody would then lose 90 league points over the five seasons where it otherwise loses 60.
- Owner money cannot fix it. Injecting owner equity does not increase the revenue the rule counts, so owner funding alone cannot solve it. The routes are selling players and earning more.
- The cost falls on the team. City keeps its points by selling the players who win them, and rebuilds to a budget about half the size of today’s. Five of the other 19 clubs spend more on their squads today than a 50% cap would allow City in the first season.
None of this is a forecast of what the commission will decide or of what City would do. It is what the rule’s own arithmetic does when one number is changed.
How we modelled it
For readers who want the mechanics. Everything here is a scenario under stated assumptions.
The two scenarios. Scenario 1 is a hard cap: the red line is the 50% threshold in every season, with no Club Error Margin. Scenario 2 applies the rule as written with 50% in place of 85%. In both, the levy and the league points deducted follow the rule’s own formulas.
The starting point. Our reconstruction of City for the 1 March 2027 test: squad cost £633.1m over revenue of £732.9m plus a three-year average of sale profit of £118.4m (the six transfer windows before the test, Rule A.1.53: £23.1m from February to June 2024, then £95.2m, £91.1m and £145.8m for 2024/25 to 2026/27, divided by three; the windows run from February 2024 to the January 2027 window, about three years, shown here by financial year), which is 74.4%, 10.6 percentage points inside the 85% line, or 86.4% before player trading, 1.4 percentage points above it. The commercial income in that revenue, £367.6m, is a one-season estimate by our published method: the £340.4m filed for 2024/25 grown by 6.9%, plus £3.7m for the women’s team. City’s figure rests on the club company’s accounts, with the women’s club’s matchday and broadcasting revenue added under the rule’s reporting perimeter. Other City Football Group companies, such as its marketing and services companies, may also sit inside the perimeter and have not yet been read; they could move the starting point. City’s filed 2023/24 UEFA figure may include Super Cup income; this scenario uses the ledger treatment of engine V2CF and makes no separate adjustment (it is listed on What the engine does not capture).
The rule applied. Appendix 2 of the 2026/27 Handbook, with 50% in place of the 85% of Rule A.1.31.
- Scenario 1, 2027/28, selling nobody: £557.2m is £151.4m above half of £811.6m (the £729.1m of revenue the rule counts in 2027/28 in the scenario, plus the £82.4m average below), which is 24 further league points, 30 in all.
- Scenario 2: Club Error Margin 30 percentage points on entry (A.1.17); reduced after a season above the threshold by the whole percentage points over (A.1.39); 10 percentage points restored after a compliant season (A.1.44).
- Levy: the overspend above the threshold multiplied by the whole percentage points over (A.1.35 to A.1.37). 2027/28: £557.2m is £151.4m above half of £811.6m; at 19% the levy is £28.8m. No relief under E.7 and E.8 is assumed; a real sanction would have to settle whether seasons before it count.
- League points: 6 plus 1 per £6.5m or part of it above the red line, multiplied by 1.3 for a second consecutive breach, 1.6 for a third and 0.3 more each season after, rounded up (F.4, F.5). Scenario 2, 2028/29, selling nobody: £18.2m over is 3 further points, 9 in all. 2029/30: £164.9m over is 26 further, 32 in all, times 1.3: 42.
- The three-year average in 2027/28 holds the sales from February to June 2025 (£0.2m: the profit on Jacob Wright to Norwich City less the loss on Kayky, sold to Bahia for nil), 2025/26, 2026/27 and the one sale already contracted for 2027/28 (Omar Marmoush to Tottenham, a profit of £10.1m): £82.4m. Each test counts the six transfer windows before it (Rule A.1.53), so every sale counts in three tests, wherever it falls in the financial year. With no further sales it is £3.4m by 2029/30.
The players. Book value is the reported fee plus 12%, written down in equal parts over the contract and scaled by 1.078 for players signed before July 2025 so that the total matches the book value City filed. The 30 players with an estimate are valued at £1,276m against £704m of book value. Market values are Transfermarkt’s, converted from euros at 0.8503. Wages are Capology’s weekly basic pay, times 52, plus the employer’s costs City files, scaled by 1.16 so that they add up to our estimate of City’s squad wages (£330.1m). A sale’s profit is the price less book value, less 5% selling costs on a gain.
The strategies. Illustrative rules, not optimal responses. Each summer in which the squad cost would otherwise be above the modelled red line, City sells in order of market value (highest first, or lowest first) until it is inside, at 20% below the estimate. The same runs at the estimate, at 30% below, and at 20% below with young players 20% above, give the same result for selling stars in both scenarios (no league points) and, in scenario 2, 33 to 37 league points for selling depth.
Reinvestment. After any sales, if the ratio is below a target City signs players up to it. The target is the red line less 2 percentage points and never above the threshold itself, which under the hard cap is 48%. A signing’s yearly cost is 45% fee (spread over five years) and the rest wage, which is the split of City’s squad cost today. Sold players are replaced only through this budget.
- Scenario 2 without reinvestment: the selling-stars path drifts far below the line: 43.9% and 35.0% in the last two seasons, with a top-four chance of 22% and 8%. With it: 50.0% and 50.0%, and 30% and 26%. New signings’ fees total £223m over the five seasons in the middle run; the table’s seasons, each its own middle run, sum to more.
- We also ran the target as the red line less the margin even when that is above 50%. City then spends up to 78% in 2027/28, 2 percentage points below the modelled red line of 80%; the allowance is gone a year early (a red line of 52% in 2028/29 where the main case has 61%), and every strategy does worse: selling nobody loses 90 league points over five seasons, selling depth 68, and selling stars has to sell five players and pays £71m of levies. Spending into the allowance is self-defeating under this rule.
Contracts that end. The player leaves and a replacement arrives at half his wage and half his yearly charge. At a quarter fewer league points are lost, at three-quarters more.
From spending to results. League points are fitted against relative staff costs on 32 club-seasons of filed accounts: doubling a club’s spending against the rest is worth about 15 points a season, with a spread of about 10 points, and it explains 42% of the variation within a season. City today is expected on 72 points. Each run’s points, less any deduction, are placed in one real final table (2021/22 to 2025/26, a fifth of the runs in each) to give a position; points are never averaged by position. With no luck either way, the first-season deduction under the hard cap takes City from a finish of 3 to 4 to one between 13 and 17, depending on the table; in scenario 2 the second-season deduction takes it from between 3 and 5 to between 4 and 8, and in one of the five tables it is still inside the top four.
From results to revenue. By our model’s own revenue rules: league prize money at the best of last season’s finish, the three-season average and 15th; European money only in a season City has qualified for. The Champions League is worth £98.2m (£84.4m of UEFA money and £13.8m of home gates, at today’s count of 5 European home matches). Both parts look back three seasons, which the scenario moves forward a year at a time: the rule counts the higher of the home matches the competition guarantees and the club’s average, and the highest of last season’s prize money from that competition, the club’s average and a reference figure. European prize money is averaged over the seasons the club played in that competition; European home matches are averaged over all three seasons. The assumption: each modelled season, and the season under way, enters at the guaranteed home matches and at the prize money the rule counted, because the scenario does not model how far City goes in Europe. So a City that stays in the Champions League counts 5, 5, 4, 4 and 4 home matches and keeps £84.4m of prize money; back after one season outside Europe it would count £81.2m, after two £84.4m and after three the reference figure, £73.0m.
Season by season: scenario 1, the hard cap
| Selling nobody | Ratio | Before player trading | Modelled red line | League points deducted | Levy | Fees of new signings | Top-four finish | Already relegated |
|---|---|---|---|---|---|---|---|---|
| 2027/28 | 68.7% | 76.4% | 50% | 30 | £28.8m | £0.0m | 1% | 0% |
| 2028/29 | 73.6% | 80.3% | 50% | 41 | £38.2m | £0.0m | <0.5% | 26% |
| 2029/30 | 79.1% | 79.6% | 50% | 55 | £51.1m | £0.0m | 0% | 70% |
| 2030/31 | 72.1% | 72.1% | 50% | 50 | £28.4m | £0.0m | 0% | 97% |
| 2031/32 | 51.5% | 51.5% | 50% | 18 | £0.1m | £0.0m | 0% | 99.5% |
| Selling stars | Ratio | Before player trading | Modelled red line | League points deducted | Levy | Fees of new signings | Top-four finish | Already relegated |
|---|---|---|---|---|---|---|---|---|
| 2027/28 | 48.0% | 55.2% | 50% | 0 | £0.0m | £11.5m | 41% | 0% |
| 2028/29 | 48.0% | 53.9% | 50% | 0 | £0.0m | £94.7m | 34% | <0.5% |
| 2029/30 | 48.0% | 51.1% | 50% | 0 | £0.0m | £3.1m | 30% | 1% |
| 2030/31 | 48.0% | 48.4% | 50% | 0 | £0.0m | £43.5m | 25% | 1% |
| 2031/32 | 48.0% | 48.4% | 50% | 0 | £0.0m | £122.5m | 22% | 2% |
| Selling depth | Ratio | Before player trading | Modelled red line | League points deducted | Levy | Fees of new signings | Top-four finish | Already relegated |
|---|---|---|---|---|---|---|---|---|
| 2027/28 | 59.8% | 66.6% | 50% | 19 | £8.0m | £0.0m | 6% | 0% |
| 2028/29 | 67.2% | 73.3% | 50% | 32 | £19.8m | £0.0m | <0.5% | 7% |
| 2029/30 | 71.6% | 72.1% | 50% | 44 | £29.1m | £0.0m | <0.5% | 40% |
| 2030/31 | 65.1% | 65.1% | 50% | 38 | £13.4m | £0.0m | <0.5% | 85% |
| 2031/32 | 48.0% | 48.0% | 50% | 0 | £0.0m | £19.6m | 1% | 93% |
In 2027 Anderson and Fernández are sold at losses of £30.4m and £47.9m; Haaland’s profit of £120.8m is what makes the arithmetic work. A fifth player, Ayyoub Bouaddi, is sold later in 74% of runs.
Season by season: scenario 2, with the allowance
| Selling nobody | Ratio | Before player trading | Modelled red line | League points deducted | Levy | Fees of new signings | Top-four finish | Already relegated |
|---|---|---|---|---|---|---|---|---|
| 2027/28 | 68.7% | 76.4% | 80% | 0 | £28.8m | £0.0m | 70% | 0% |
| 2028/29 | 63.3% | 68.2% | 61% | 9 | £13.6m | £0.0m | 20% | <0.5% |
| 2029/30 | 76.3% | 76.7% | 50% | 42 | £42.9m | £0.0m | <0.5% | 3% |
| 2030/31 | 69.4% | 69.4% | 50% | 40 | £22.4m | £0.0m | 0% | 63% |
| 2031/32 | 50.8% | 50.8% | 50% | 14 | £0.0m | £0.0m | <0.5% | 87% |
| Selling stars | Ratio | Before player trading | Modelled red line | League points deducted | Levy | Fees of new signings | Top-four finish | Already relegated |
|---|---|---|---|---|---|---|---|---|
| 2027/28 | 68.7% | 76.4% | 80% | 0 | £28.8m | £0.0m | 69% | 0% |
| 2028/29 | 54.8% | 62.1% | 61% | 0 | £2.0m | £0.0m | 47% | <0.5% |
| 2029/30 | 50.9% | 54.8% | 56% | 0 | £0.1m | £0.0m | 36% | <0.5% |
| 2030/31 | 50.0% | 53.3% | 55% | 0 | £0.0m | £84.4m | 30% | <0.5% |
| 2031/32 | 50.0% | 50.6% | 61% | 0 | £0.0m | £139.0m | 26% | 1% |
| Selling depth | Ratio | Before player trading | Modelled red line | League points deducted | Levy | Fees of new signings | Top-four finish | Already relegated |
|---|---|---|---|---|---|---|---|---|
| 2027/28 | 68.7% | 76.4% | 80% | 0 | £28.8m | £0.0m | 70% | 0% |
| 2028/29 | 60.7% | 66.9% | 61% | 0 | £8.6m | £0.0m | 45% | <0.5% |
| 2029/30 | 58.6% | 61.5% | 50% | 18 | £5.3m | £0.0m | 7% | 1% |
| 2030/31 | 59.3% | 61.2% | 50% | 21 | £5.4m | £0.0m | 3% | 13% |
| 2031/32 | 48.0% | 49.4% | 50% | 0 | £0.0m | £68.7m | 18% | 29% |
Middle of the modelled runs still in the League. Top-four finish and relegation are shares of all runs. In scenario 2 Haaland is sold in 2028 for a profit of £123.9m, and Elliot Anderson a year later, followed in 48% of runs by Enzo Fernández.
How firm the figures are
Under the hard cap, league points lost over five seasons run from 30 to 126 across the runs for selling nobody and from 47 to 132 for selling depth; with the allowance, from 41 to 104 and from 25 to 68. Three things drive that: what replaces a player whose contract ends, how closely a season’s result follows spending, and which season’s table the points land in.
Limits
- Replacements at half cost. By 2031/32 most of today’s contracts have ended, so costs fall in the last season whatever the strategy. That fall is this assumption at work, not a finding.
- Simple sales rules. The strategies sell only when a breach is otherwise due, strictly in order of market value. A club planning ahead would sell earlier, choose by profit as well as value, and do better than either rule. New signings are generic: they cannot be sold and add no sale profit later.
- The link between spending and league points explains under half of what happens. It captures the long-run tendency, not a season’s luck, and cannot see how well a club is run. Only the wage part of new spending feeds it.
- Market values and wages are public estimates, not filed or club-stated figures.
- Youth wages are missing. No usable wage is recorded for Mathys Detourbet, Jeremy Monga, Sverre Nypan, Claudio Echeverri, Juma Bah and Pierce Charles. Selling them saves only their amortisation in the model, so the saving from selling depth is understated by an amount we cannot measure.
- Prices are held at today’s level. No wage inflation, no revenue growth and no reaction from sponsors to a weaker team; on that last point the revenue falls shown are a lower bound. Today’s commercial income is itself a one-season estimate (the £340.4m filed for 2024/25 grown by 6.9%, plus £3.7m for the women’s team), and the scenario holds it in every later season: an assumption, not a forecast.
- European home matches at the guaranteed number. A season the scenario models, and the season under way, are counted at the guaranteed number of home matches of the competition, because the scenario does not model knockout rounds. A club that went further in Europe would count more home matches in the seasons after.
- European prize money at what the rule counted. A season the scenario models, and the season under way, recognise the amount the rule counted for the club in that season. The scenario does not model how far City would go in Europe, so it cannot say what a modelled European season would really earn.
- Agents’ fees are held. The agents’ fees in the squad cost stay at today’s figure in every season, whatever is bought or sold. In practice they would follow City’s own signings and renewals. The effect is not sized.
- Qualifying rounds are taken as passed. A place in Europe that enters through a qualifying or play-off round is treated as having passed it. Failing such a round would take that season’s European prize money and home matches out of the income the rule counts, so this can only overstate City’s income. Which places enter that way is not checked, and the effect is not sized.
- Relegation ends a run. The Championship is not modelled.
- Five tables are five examples, not a forecast of the next five seasons.
More on the Manchester City caseThe ruling, what it could cost City, and what it cost the others
Sources and caveats.
The decision. As set out in our article of 29 September 2026, from the commission’s published decision. City dispute the findings and have appealed (2 October 2026). No sanction has been set, and a squad cost cap is not among the standard sanctions.
The rules applied. Premier League Handbook 2026/27, Appendix 2: Rules A.1.4, A.1.13, A.1.17, A.1.29, A.1.31, A.1.35 to A.1.37, A.1.39, A.1.44, A.1.48, C.4, D.2, E.7, E.8, F.4 and F.5, with 50% in place of the 85% of A.1.31.
What is estimated. City’s current ratio is our reconstruction from Manchester City Football Club Ltd’s accounts and the transfer record to 23 September 2026 (engine V2CF). Market values (Transfermarkt, values dated May to September 2026) and wages (Capology, read 4 October 2026) are public estimates. Contract extensions for Rúben Dias, Phil Foden, Joško Gvardiol and Abdukodir Khusanov are taken from press reports. Final league tables for 2021/22 to 2025/26 are from a secondary source.
Independent estimate, not an official calculation, and not advice. A hypothetical scenario. Figures produced 8 October 2026 and rerun on 23 and 26 October 2026 (scenario version V2CF).
Corrections and updates (8)
7 October 2026 · New evidence · several figures: see the note
Update, 7 October 2026. Figures in this note are from the V2BS rerun. The scenario has been rerun on our current estimate of Manchester City, and the figures, tables and charts below are the new ones. City’s starting point is now 75.7%, from 76.1% (87.5% before player trading, from 88.0%). The reason is the European prize money the rule counts: it is now the average of City’s last three seasons, two from its filed accounts and one our estimate, which comes to £84.4m; it was a single estimate of £80.0m before. That takes the income the rule counts to £711.3m, from £706.8m. Elliot Anderson’s signing is also now dated to its completion on 23 July 2026, which leaves £105.2m of his fee on the books in July 2027, from £103.9m. City’s filed 2023/24 UEFA figure may include Super Cup income; this scenario uses the V2BS ledger treatment and makes no separate adjustment.
What moves in the scenario. Under the hard cap with nobody sold, City loses 31 points in the first season, from 32: the gap to the cap is £162m, from £164m, and that deduction now leaves City between 14th and 17th, from between 15th and 17th. The Champions League is worth £95m of the income the rule counts, from £91m. Anderson’s sale in 2027 loses £30m, from £29m, and in the second scenario his sale in 2029 makes £21m, from £22m; in that scenario the levies paid come to £37m, from £38m. One change there is a threshold effect, not a trend. Enzo Fernández is now sold in 82% of runs, from 95%, and the middle run of that strategy ends 2029/30 at 50.4%, from 50.0%: a fraction over the line. No points are deducted, but a season over the line earns no allowance back, so the modelled red line in 2030/31 is 52%, from 61%. The result is the same: no points are deducted in any season.
One figure moves a long way for a small reason. Selling the least valuable players first under the hard cap now loses 64 points over five seasons in the middle run, from 88 (range 44 to 126, from 28 to 129). That is not an improvement. In this strategy about half of the runs are relegated after two seasons, and a relegated club loses no further points in our model; the share relegated by then is now 51%, from 49%, so the middle run has moved from one side of that divide to the other. The first-season deduction is 20 points, from 21, and relegation within five seasons is 97%, unchanged.
What does not change. With nobody sold City is still in breach from the first day and relegated within five seasons in almost every run. Selling from the top of the squad, starting with Erling Haaland, is still the only one of the three strategies that keeps every point: the same four players in the summer of 2027, two of them at a loss, with no points lost at any of the sale prices we tested. City’s top-four chance still falls from 69% to 40% at once. With the rule’s allowance the sales still come a year or two later and on better terms, and the two scenarios still end in much the same place. This is a hypothetical scenario, not a prediction.
7 October 2026 (second) · Regulatory interpretation · several figures: see the note
Update, 7 October 2026, second update of the day. Figures in this note are from the V2BT rerun. The scenario has been rerun again, on our current estimate of Manchester City, and the figures, tables and charts below are the new ones; the earlier update above describes the first rerun. City’s starting point is now 75.4%, from 75.7% (87.1% before player trading, from 87.5%). The reason is the number of European home matches the rule counts. It takes the higher of the home matches City is guaranteed in the Champions League this season, four, and the average of its last three seasons in that competition, five; we had counted four. The extra home gate takes City’s European matchday income to £13.8m, from £11.0m, and the income the rule counts to £714.0m, from £711.3m. The cost of the squad is unchanged at £622.2m.
In the scenario’s later seasons the three seasons behind that average move forward a year at a time, and a season outside the competition counts as none. A season the scenario models, and the season under way, are counted at the guaranteed number of home matches of the competition, because the scenario does not model knockout rounds. So a City that stayed in the Champions League throughout would count five home matches in 2027/28 and 2028/29 and four from 2029/30. One home match is worth £2.8m of the income the rule counts.
The European prize money moves forward in the same way, by the rule’s own method: the highest of what the club recognised from the competition the season before, its average over the seasons it played in that competition, and a reference figure for the competition. European prize money is averaged over the seasons the club played in that competition; European home matches are averaged over all three seasons. A season the scenario models, and the season under way, recognise the amount the rule counted for the club in that season; a season outside Europe recognises nothing. The scenario does not model how far City would go in Europe, so it cannot say what a modelled European season would really earn; it carries forward what the rule counted. So a City that stays in the Champions League keeps £84.4m. One that misses a season and returns counts £81.2m, the average of its two remaining seasons in the competition; after two seasons out it counts £84.4m, its one remaining season. Two seasons out counts more than one because the average is taken over the seasons played in the competition, not over three. Only with no season in the competition left in the three does it fall to the reference figure, £73.0m.
What moves in the scenario. Under the hard cap with nobody sold, City still loses 31 points in the first season: the gap to the cap is £161m, from £162m, and half of City’s income for the test is £396m, from £395m. The Champions League is worth £98m of the income the rule counts, from £95m. City’s top-four chance with the squad intact is 68%, from 69%, so the fall after the four sales is from 68% to 40%. Selling the most valuable first takes the first-season ratio to 48.5%, from 48.6%; selling the least valuable first leaves it at 61.2%, from 61.4%. The season-by-season tables in the modelling section carry the rest of the changes.
One change is a threshold effect, not a trend. The rule counts a breach in whole points. With nobody sold, City’s ratio in 2027/28 is 70.3%, from 70.5%, which rounds to 20 whole points over the 50% line where it rounded to 21. The levy that season, the overspend multiplied by those points, is £32.2m, from £34.1m. In the second scenario it leaves 10 points of allowance for 2028/29, from 9: the modelled red line that season is 60%, from 59%, and the deduction with nobody sold is 13 points, from 14. In that scenario’s strategy of selling the most valuable first, a point more allowance and a little more income mean fewer runs need the third sale: Enzo Fernández is sold in 76% of runs, from 82%, the middle run ends 2029/30 at 51.6%, from 50.4%, inside a modelled red line of 54%, from 53%, and the levies paid come to £36m, from £37m. The results are the same. Selling the most valuable first loses no points in any season. Selling nobody still loses 43 points in 2029/30 and is relegated within five seasons in 93% of runs.
No five-season total jumps this time. Selling the least valuable players first under the hard cap still loses 64 points over five seasons in the middle run (range 44 to 126). That is still not an improvement on the 88 this article first printed: 51% of runs are already relegated after two seasons, unchanged, and a relegated club loses no further points in our model; 97% are relegated within five seasons, also unchanged. With nobody sold the middle run loses 74 points over five seasons under the hard cap, where almost every run is relegated, and 64 with the allowance, where 93% are; neither moves, and the range of the second is 46 to 108, from 47 to 109.
What does not change. With nobody sold City is still in breach from the first day and relegated within five seasons in almost every run. Selling from the top of the squad, starting with Erling Haaland, is still the only one of the three strategies that keeps every point: the same four players in the summer of 2027, two of them at a loss, with no points lost at any of the sale prices we tested. With the rule’s allowance the sales still come a year or two later and on better terms, and the two scenarios still end in much the same place. Five of the other 19 clubs still spend more on their squads than the cap would allow City in the first season. This is a hypothetical scenario, not a prediction.
9 October 2026 · Methodology change · several figures: see the note
Update, 9 October 2026. The scenario has been rerun on our current estimate of Manchester City, and the figures, tables and charts below are the new ones; the two updates above describe the earlier reruns. City’s starting point is now 73.8%, from 75.4%, which is 11.2 percentage points inside the 85% line. Before player trading it is 84.9%, from 87.1%: 0.1 percentage points below that line. The reason is commercial income. Last season’s figure is not yet filed, and we now estimate it by one published method for every club: the £340.4m filed for 2024/25 grown by 6.9%, plus £3.7m for the women’s team, which comes to £367.6m, from £348.7m. Those commercial figures are inputs, taken from the ledger our current estimate of City is built from; they are not results of the scenario. That takes the income the rule counts to £732.9m, from £714.0m. The cost of the squad is unchanged at £622.2m. The scenario holds that commercial figure in every later season: an assumption, not a forecast.
What moves in the scenario. Every change below follows from £18.9m more income in every season. Under the hard cap with nobody sold, City loses 30 league points in the first season, from 31: the gap to the cap is £151.4m, from £160.9m, which is 24 units of £6.5m or part of one where it was 25. That deduction leaves City between 13th and 17th, from between 14th and 17th. Half of City’s income for the test is £406m, from £396m. With nobody sold, 99.5% of runs are relegated within five seasons, from 99.9%. City’s top-four chance with the squad intact is 69%, from 68%, and after the four sales 41%, from 40%. Selling the most valuable first now takes City under the cap with room to buy again in the same summer, up to 48.0%, 2.0 percentage points under it; selling the least valuable first leaves it at 59.8%, from 61.2%, 9.8 percentage points over. The season-by-season tables in the modelling section carry the rest of the changes.
The rule counts in whole numbers, so some figures move in steps. With nobody sold, City’s ratio in 2027/28 is 68.7%, from 70.3%, which is 19 whole percentage points over the 50% line where it was 20. The levy that season is £28.8m, from £32.2m. In the second scenario that leaves 11 percentage points of allowance for 2028/29, from 10: the modelled red line that season is 61%, from 60%, and the deduction with nobody sold is 10 league points, from 13.
One five-season total moves a long way. Selling the least valuable players first under the hard cap loses 91 league points over five seasons in the middle run, from 64 (range 47 to 133, from 44 to 126), with 42% of runs relegated after two seasons, from 51%, and 94% within five, from 97%. This article first printed 88 for that figure, then 64. The total stops when a run is relegated, and it sits on a threshold: whether the middle run is still in the League for a third season. With 51% of runs relegated after two seasons it was not, and the figure was 64; with 42% it is, and that season’s deduction, 44 league points in the middle run, is added. The other five-season totals, each with its share of runs relegated within five seasons: with nobody sold, 72 league points under the hard cap, from 74 (99.5% relegated), and 61 with the allowance, from 64 (87%, from 93%); selling the least valuable first with the allowance, 37, from 44 (31%, from 44%).
With the allowance, selling the most valuable first needs less. Erling Haaland is sold in 2028 and Elliot Anderson in 2029, as before. Enzo Fernández is sold in 55% of runs, from 76%, and with no luck either way he is no longer sold; under the hard cap he is sold in every run. The levies paid come to £33m, from £36m, and no league points are deducted in any season.
What does not change. With nobody sold City is in breach from the first day. Selling from the top of the squad, starting with Erling Haaland, is still the only one of the three strategies that keeps every league point: the same four players in the summer of 2027, two of them at a loss, with no points lost at any of the sale prices we tested. With the rule’s allowance the modelled red line is still 50% by 2029/30, and City’s top-four chance in 2031/32 is 26%, against 23% under the hard cap. Five of the other 19 clubs still spend more on their squads than the cap would allow City in the first season. This is a hypothetical scenario, not a prediction.
15 October 2026 · Editorial · several figures: see the note
Clarification, 15 October 2026. Wording only; no figure changed. The shares of runs in this article, such as relegation within five seasons or a top-four finish, are conditional scenario frequencies: shares of the scenario’s simulated runs under its stated assumptions, not real-world probabilities. Where the notes above speak of a “chance”, they mean that share of runs.
23 October 2026 · Methodology change · several figures: see the note
Correction, 23 October 2026. Two readings of the rule we have since corrected reached the scenario, and it is rerun with everything else as before.
- City’s starting point. Rule A.1.22(c) caps the spreading of a transfer fee at five years for any contract signed since 12 December 2023, and we had not applied the cap to registrations already in City’s filed book value: that adds £5.2m to the squad cost, now £627.4m. Rule A.1.53 averages the profit on player sales over the six most recent transfer windows, not three financial years: that adds City’s £23.1m of sales from February to June 2024, and the average is £118.4m, from £110.7m. City’s ratio is 73.7%, from 73.8%, and 85.6% before player trading, from 84.9%: now 0.6 percentage points above the 85% line, where this article said 0.1 below it.
- The later seasons. The scenario took each later season’s average over three financial years too. It now takes each test’s six windows, which adds City’s sales from February to June 2025 (Jacob Wright to Norwich City, £2.2m of profit, from the club’s announcement) and from February to June 2026 (£12.9m) to the tests that count them.
- What moved: under the hard cap, selling nobody loses 71 league points over five seasons in the middle run, from 72 (range 30 to 126); selling the least valuable first loses 92, from 91 (range 47 to 132), with 40% of runs relegated after two seasons, from 42%, and 93% within five, from 94%. With the allowance, selling nobody loses 60, from 61, and selling the least valuable first 36, from 37, with 29% of runs relegated, from 31%. Enzo Fernández is sold in 48% of runs, from 55%. Elsewhere league points move by one or none and the levies by up to £1.3m; the 30 league points in the first season, the 99.5% relegated with nobody sold, the four players sold in the first summer and City’s top-four chance (69%, then 41% after the sales) are unchanged. The two charts of strategies are redrawn.
- The article’s conclusions do not change. A hypothetical scenario, not a prediction. See the engine changelog and What the engine does not capture.
24 October 2026 · Methodology change · no figure changed
Correction, 24 October 2026. No figure changed. This article said the rule averages profit on player sales over the last three years. It takes the profit or loss on sales in the six most recent transfer windows and divides it by three (Rules A.1.13 and A.1.53). Six windows cover about three years, but a club’s sales from February to the end of its financial year fall in a later window than the rest of that year, so they stay in the average for one test longer. The sentence now says six transfer windows. The figures in this article already count sales by window.
25 October 2026 · Data correction · no figure changed
Correction, 25 October 2026. No figure changed. City appealed on 2 October (Premier League statement of that day); three sentences said they would. The note of 23 October did not record that the top-four chance in 2031/32 under the hard cap moved to 22%, from 23% in the note of 9 October; it is recorded here. The £272m and £221m of new signings are the middle run over five seasons, which is why the tables, each season its own middle run, sum to more; the sentences now say so. The income the 2027/28 test is measured against, £812.2m, is the scenario’s revenue for that season plus its £83.1m average, not today’s £732.9m plus that average; the source line now says so. And the date of the figures now includes the rerun of 23 October.
26 October 2026 · Regulatory interpretation · several figures: see the note
Correction, 26 October 2026. The scenario is rerun on engine V2CF, as a new scenario version, with the same parameters, random seed and number of runs. Two inputs to City’s figures have changed.
- The head coach’s fee. Rule A.1.22(d) counts fees paid for a head coach in the squad cost. City’s fee for Enzo Maresca, reported in June 2026 as £17.2m over three years and not yet in filed accounts, adds £5.7m a year: the squad cost is £633.1m, from £627.4m. City’s ratio is 74.4%, from 73.7%, 10.6 percentage points inside the 85% line, from 11.3; before player trading it is 86.4%, from 85.6%, now 1.4 percentage points above the 85% line, from 0.6. Revenue (£732.9m) and the average of sale profit (£118.4m) are unchanged.
- Kayky’s sale. Rules A.1.13 and A.1.53 count the profit or loss on sales in each transfer window. City’s sale of Kayky to Bahia for nil, in the February to June 2025 window, is now counted: he still carried book value from his 2021 signing, so it is a loss of £2.0m, against the £2.2m profit on Jacob Wright to Norwich City in the same window. The 2027/28 test’s average is £82.4m, from £83.1m.
- What moved: under the hard cap with nobody sold, the 2027/28 ratio is 68.7%, from 68.6%, the gap to the cap £151.4m, from £151.1m, and the levy £28.8m, from £28.7m; selling the least valuable first leaves City at 59.8%, from 59.7%. With no luck either way the first-season deduction leaves City between 13th and 17th, from between 13th and 16th. With the allowance, Rayan Cherki is sold in 3% of runs, from 2%, and with nobody sold the league points lost over five seasons range from 41 to 104 across the runs, from 41 to 103. Elsewhere the season tables move by at most a percentage point, and the levies and new signings’ fees by up to £0.7m. The 30 league points in the first season, the 99.5% relegated with nobody sold, the four players sold in the first summer, every five-season total and share of runs relegated within five seasons, and City’s top-four chance (69%, then 41% after the sales) are unchanged. The two charts of strategies are redrawn.
- The conclusions hold as they did: the same fifteen of the eighteen tested hold, and the three that are worded with their margins still carry them. A hypothetical scenario, not a prediction. See the engine changelog and What the engine does not capture.