
Aston Villa · Financial analysis
Aston Villa's squad cost ratio: one summer of selling that carries the average
Aston Villa's squad cost ratio for the 1 March 2027 test comes out at about 74%, inside the 85% green threshold with roughly £57m of annual spending headroom. Measured before profit on player sales it is 96.9%, above the threshold even with £120m of merit above the fifteenth-place floor and European amounts in the revenue. £122.7m a year of averaged player-sale profit closes the gap, and three fifths of it comes from a single summer. Four players who had cost Villa £48.0m were sold for £253m in 2026 and produced £211m of profit. Reconstructed from NSWE UK Ltd's consolidated accounts and Appendix 2 of the Premier League Handbook.
Figures as of 31 October 2026, Orange Engine release V2CI · Latest figures · What the engine does not capture
SCR 2026/27·Post-summer projection
Latest change to the figures, 31 October 2026: the twenty clubs together come to 75.3%, from 75.1%; the ratio, 74.2%, is unchanged. Latest correction, 1 November 2026: the UEFA section and the merit label, with no figure in the ratio changed. All 18 correction notes are at the end.
Aston Villa sold four players for £253m in the summer of 2026. Together they had cost the club £48.0m, and between them they produced £210.5m of profit on sale, after the share of one sale owed to the player’s former club.
| Aston Villa | 2026/27 |
|---|---|
| Squad cost ratio, 1 March 2027 test | 74.2% |
| SCR before player trading | 96.9% |
| Merit above the floor and European amounts | 41.6 percentage points |
| Effect of player-sale profits | 22.7 percentage points |
| Green headroom | +£56.5m |
| Assumption range | 68.8 to 77.0% |
| Assumption range against 85% | entirely below the line |
| Stress case (costs only) | 84.3% |
| Largest single year’s share of sale profit | 60% |
Villa’s squad costs £388.2m against £400.5m of the football revenue the rule counts, which is a ratio of 96.9% before any player trading, above the 85% threshold. That revenue includes £120.3m of merit above the fifteenth-place floor, European distribution and European home gate, and the three-year average of profit on player sales adds £122.7m a year. That takes the figure to 74.2%. The stress case, which sets every uncertain cost against the club at once and holds revenue at the central estimate, is 84.3%, just inside the line. Most of that averaged profit comes from the one summer described above, so the headroom rests on a Champions League place and a selling year that does not recur on demand.
- The squad cost is £388m: £219m of wages, £128m of amortisation, about £26m of agents’ fees and £15m of wages for two players on loan.
- The ratio has to be built from NSWE UK Ltd’s consolidated accounts rather than from either football company’s own, because one company records the income and another employs the players and holds their registrations.
- £219.6m of sale profit falls in the year to June 2027, against £34.6m the year before and £52.0m the year before that.
- The club’s lender, Goldman Sachs, holds security over Premier League central funds, broadcast income and the group’s other receivables, and the directors’ going-concern statement names increased player trading as the fallback if the league finish disappoints.
Taken together, the twenty clubs of this season’s Premier League come to 75.3% on the same basis; Aston Villa’s 74.2% is below that. The full table for every club in the series is at Premier League SCR 2026/27.
What the accounts say
The playing squad is not employed by the company that records the club’s income. Aston Villa Football Club Ltd (company 03375789) files £359.3m of turnover and £17.8m of wages. The players, their registrations and the Premier League share are in a sister company, Aston Villa FC Ltd (02502822), which files £214.2m of wages and £310.1m of turnover, £300.1m of it from group companies. NSWE UK Ltd (10176070) has no employees other than its directors and is the largest group to consolidate both companies’ financial statements; the ultimate parent is V Sports S.C.S. in Luxembourg. The ratio is therefore built from NSWE UK Ltd’s consolidated accounts.
NSWE UK Ltd files to 30 June. The year to 30 June 2025 followed a thirteen-month period, after a change of year end from May.
Turnover was £378.1m.
| Revenue | £m |
|---|---|
| Broadcasting | 170.7 |
| UEFA | 70.2 |
| Commercial | 70.1 |
| Gate receipts | 38.5 |
| Sponsorship | 28.6 |
| Total | 378.1 |
UEFA income of £70.2m came from a Champions League run to the quarter-finals, and it accounts for most of the £102m rise in turnover on the previous period.
Wages were £237.8m, and with £33.8m of social security the staff cost was £273.4m. The accounts give a headcount of 294 players, football management and coaches, 449 other staff and 480 part-time.
Amortisation of registrations was £99.7m, with a further £6.5m of impairment. Profit on player sales was £52.0m, against £64.8m in the thirteen-month period before, and £161.5m was invested in registrations in the year. The group made a loss before tax of £96.8m. Net current liabilities fell from £71.1m to £20.6m.
The transfer book is close to balanced: £148.9m owed to other clubs and £143.7m owed to Villa, so Villa are net debtors by £5.2m. The discount released on receivables, £10.3m, is larger than the discount charged on payables, £7.2m.
Agents’ fees paid in the FA’s reporting period were £38.4m.
The going-concern statement assumes that the club’s revolving facility remains available, and sets out what the directors would do if a lower league finish reduced income: increase player trading, which they describe as “not guaranteed”, or seek shareholder support that is “not yet committed”.
Rebuilding the ratio, before any selling
Wages, about £219m. The rule counts contract players and the head coach. NSWE UK Ltd files £273.4m of staff cost and groups 294 players, football management and coaches together, so the player share cannot be observed directly. This reconstruction currently uses 78 to 83% of the staff cost, carried forward through the 2025 window and the 2026 window, which removed six senior earners at once, Watkins, Konsa, Martínez, Tielemans, Digne and Bailey, against a younger and mostly cheaper intake.
A separate player-by-player salary build implies a materially lower share, but it covers fewer registered players than the filing does. The filed headcount cross-check cannot validate the range either, because it does not separate players from coaches and football management. The difference remains unresolved, and it is one of the largest uncertainties in the reconstruction.
Amortisation, £128.2m, built registration by registration from the filed net book value rather than rolled forward from the filed charge. Players signed since the last filed accounts are counted at the reported fee plus 12% for the League’s transfer levy and agents’ fees, which is how the rule defines what a registration costs, and that cost is spread over the contract, measured from the day the player was registered to the day it ends. A registration already in the filed book value whose contract was signed or extended on or after 12 December 2023 for more than five years is charged over five years, as Rule A.1.22(c) requires, which adds £1.6m, most of it Ian Maatsen’s six-year contract. The 2026 purchases add to the charge at once, which is the point returned to below.
Agents’ fees, about £25.9m, expensed, from the FA’s published figure of £38.4m.
Wages for players on loan, £15.0m. Villa pay the wages of Alejandro Garnacho and Aaron Wan-Bissaka and hold no registration for either, so the cost enters the numerator with no amortisation attached to it, which is how a loan works. That is a full-season figure on loans that began on 23 July and 21 August; on a day basis it would be about £1.1m lower.
Revenue the rule counts, £400.5m. The merit payment is taken at fourth place, being the best of last season’s finish, the three-year mean and the fifteenth-place floor. Commercial revenue counts merchandise at gross profit: Villa’s accounts give no merchandise figure, so the cost of the goods is estimated from the clubs that do, at £7.0m in a range of £2.9m to £15.4m, and taken off.
European revenue is taken under Rule A.1.29(e), which pays a reference amount rather than what a club earns. It is the highest of three figures: what the club recognised from that competition in the prior season, its three-year mean in that competition, and the estimated mean distribution for the round of 16 in that competition. Villa won the Europa League in 2025/26 and are in the Champions League for 2026/27, so the Europa League campaign does not count toward the Champions League figure. On this reconstruction the round-of-16 reference of £73.0m is the highest of the three and binds. It is reconstructed rather than published, with a range of £68m to £82m, and is the other large uncertainty here. The £400.5m also counts £3.4m for playing in the 2026 UEFA Super Cup, which the rule counts in the season it is played (Rule A.1.29(h)): UEFA paid each club €4m, and Villa lost the match to Paris Saint-Germain, so the winner’s €1m is not theirs. The €4m is converted at the European Central Bank’s rate for the day of the match.
The squad therefore costs £388.2m, made up of £219.1m of wages, £128.2m of amortisation, £25.9m of agents’ fees and £15.0m of loan wages, each rounded separately, against £400.5m of revenue. That is 96.9% before any player trading, 11.9 points the wrong side of the threshold.
How much of the revenue rests on the rule’s own bases
| Set by the rule’s bases | £m |
|---|---|
| Merit payment above the fifteenth-place floor | 41.4 |
| European distribution under A.1.29(e) | 73.0 |
| European home gate | 5.9 |
| Total | 120.3 |
Villa earned the merit by finishing fourth, £41.4m more than the fifteenth-place floor would pay, and the European amounts follow from reaching the Champions League. Measured at the floor and with no European money, the same cost base would produce 138.5% instead of 96.9%, which is 41.6 points. All other revenue stays fixed, so this compares the rule’s bases and is not a forecast. Both parts have to be earned again each season.
What player trading does to it
The rule admits profit on player sales into the denominator: the profit or loss on sales in the six most recent transfer windows, divided by three (Rules A.1.13 and A.1.53). For the March 2027 test that period starts on 2 February 2024, so it takes in the end of Villa’s thirteen-month period to June 2024. At Villa that average is carrying the club, and one year is carrying the average.
| Period | Sale profit, £m | Basis | Main sales |
|---|---|---|---|
| February to June 2024 | 61.8 | reconstructed | Luiz to Juventus, Kellyman to Chelsea, Iroegbunam to Everton |
| 2024/25 | 52.0 | filed | Durán to Al Nassr |
| 2025/26 | 34.6 | reconstructed | Ramsey to Newcastle, Malen to Roma, Barrenechea to Benfica |
| 2026/27 to date | 219.6 | reconstructed | Rogers, Konsa, Watkins, Tielemans |
| Three-year average | 122.7 | the figure the rule counts |
£388.2m divided by £400.5m plus £122.7m gives 74.2%. The 2027 year is 60% of the pool the average is taken over.
Malen and Barrenechea sit in the year to June 2026 because that is when their moves became final: Malen’s transfer completed in May, and Barrenechea’s loan turned into an obligation to buy in October 2025. The dates on which Italian and Portuguese windows allowed them to be registered, in June and July 2026, do not decide the year.
Why one summer is so large
Profit on a sale is the proceeds less the registration’s remaining book value, not the proceeds less the original fee. Book value is what remains of the registration’s cost, which the rule counts as the fee plus 12%. Two further amounts come off: an allowance of 5% for the direct costs of the sale, and any share of the profit owed to a former club under a sell-on clause. A club that bought cheaply years ago, or for nothing, converts almost the whole price into profit, and four sales did that at once.
| Player | Cost, £m | Sold for, £m | Book value at sale, £m | Owed to former club, £m | Profit, £m |
|---|---|---|---|---|---|
| Morgan Rogers | 8.0 | 117.0 | 5.7 | 20.3 | 85.5 |
| Ezri Konsa | 12.0 | 51.0 | 0.0 | 0.0 | 48.5 |
| Ollie Watkins | 28.0 | 50.0 | 4.4 | 0.0 | 43.3 |
| Youri Tielemans | 0.0 | 35.0 | 0.0 | 0.0 | 33.3 |
| Four sales | 48.0 | 253.0 | 10.1 | 20.3 | 210.5 |
Rogers cost an initial £8m from Middlesbrough in 2024 and was sold to Chelsea for £117m two and a half years later, with £5.7m still on the books. Not all of the profit is Villa’s to keep. Middlesbrough kept a clause entitling them to 20% of any future profit, measured against a £15.5m purchase price and reported at £20.3m, so Villa’s profit is £85.5m rather than the £105.8m the sale would otherwise produce. The Rogers chain follows the same money through both clubs.
Konsa and Watkins were both bought from Brentford, in 2019 and 2020. Konsa had been written off entirely by the time he left for Arsenal at a base fee of £51m. Watkins had not: when a contract is extended, the remaining book value is spread over the new, longer term, and his extension in October 2023, to 2028, left £4.4m on the books, of the £28.0m fee plus 12%, when he went to Al Hilal for £50m. Tielemans is the simplest case: he arrived on a free transfer from Leicester in 2023, so he carried no book value at all, and nearly the whole of his £35m fee from Manchester United became profit. Each row is rounded separately, so the profits sum to £210.6m against the exact total of £210.5m.
The purchasing side of the same window runs on a different clock. Nicolas Jackson at a base fee of £47.5m, Johan Manzambi at £52m and Ibrahim Mbaye at £47m each create an amortisation charge over several seasons. For the Premier League calculation that charge is capped at a five-year period, because all three were signed after 12 December 2023. A sale lands its profit at once, while a purchase spreads its cost, and the difference between those timings is where Villa’s headroom comes from and where it will go.
When the 2027 year leaves the three-year average, the profit it contributes goes with it. On the present cost base, with nothing to replace it, the figure moves back toward the 96.9% measured before any trading.
The ratio over time
The same formula for each period, with the figure before player trading beside it. The historical periods use filed turnover; the 2026/27 row uses the revenue the rule counts. The period to June 2024 is thirteen months and is not annualised.
| Period | Revenue, £m | Wages, £m | Amortisation and impairment, £m | SCR | SCR before player trading |
|---|---|---|---|---|---|
| Year to May 2022 | 178.4 | 107 to 114 | 82.5 | about 94% | about 112% |
| Year to May 2023 | 217.7 | 152 to 161 | 92.5 | about 101% | about 119% |
| 13 months to June 2024 | 275.7 | 197 to 209 | 96.5 | about 93% | about 114% |
| Year to June 2025 | 378.1 | 213 to 227 | 106.2 | about 81% | about 91% |
| 2026/27 | 400.5 | 219 | 128.2 | 74.2% | 96.9% |
How the filed periods are built. Revenue and amortisation are read from each period’s filed accounts. Wages are 78 to 83% of each period’s filed staff cost, the same share used for 2026/27, and each period’s agents’ fees are the FA’s published figure for the reporting period that overlaps most of it. The SCR column adds the three-year average of sale profit, as the rule does.
For three periods Villa’s squad cost ran at 112 to 119% of revenue before player trading, and the same periods led to the 2024 breach of UEFA’s rules.
Under the old profitability rules Villa also booked gains on selling assets within the group. Aston Villa Ltd’s accounts for the year to June 2025 show a £111.0m profit on disposal of subsidiaries, £75.0m on the women’s club and £36.0m on a subsidiary holding the warehouse operating rights, both sold to NSWE Holding Ltd, and a profit for the year of £110.9m. Neither figure reaches this reconstruction. A sale from one group company to another is eliminated when the group’s accounts are consolidated, and NSWE UK Ltd’s consolidated accounts are where the ratio is built.
The year to June 2025 brought £102m of revenue growth, £70m of it from the Champions League, and took the figure before trading to about 91%. That was the first period in which the ratio on the rule’s basis came inside the line, at about 81%. In the three periods before it, the rule’s figure sat at about 93 to 101%, even with the profits from Grealish’s and Luiz’s sales in the three-year average. Luiz’s sale in June 2024, Durán’s in the following year, and now Rogers’s, have each put a large profit into the average in turn, and that, with the Champions League, is what holds the 2026/27 figure at 74.2%.
UEFA is a second test
Villa are in the Champions League, so UEFA’s own squad cost rule applies as well, at 70% on a calendar-year basis, a tighter line than the League’s 85%.
The club has been sanctioned twice. In July 2025 it agreed a settlement with UEFA with a fine of €11m: €5m for breaching the football earnings rule and €6m for exceeding the squad cost limit, then 80%, in 2024. Separately, in June 2026 it was fined €22.5m for a significant breach of the squad cost rule in 2025, the first year at 70%, of which €15m is reported as conditional on the ratio continuing to fall in 2026. It cannot add players to its UEFA List A for 2026/27 without a positive transfer balance.
We do not publish a figure for calendar 2026. That year straddles two financial years, and the accounts for the year to June 2026 are not due until 31 March 2027.
The financing structure
Villa’s borrowing is secured across a number of group companies and works as one structure. Goldman Sachs provides a £100m revolving facility to June 2029, with £77.0m drawn, and a £32.5m factored receivable loan agreement running to July 2027, both at SONIA plus 2.375%. Interest payable rose from £6.5m in the preceding thirteen-month period to £20.0m in the year to 30 June 2025.
The security package was registered in four successive waves, beginning on 22 to 26 November 2024, then on 11 April 2025, 30 October 2025 and 30 July 2026, against group companies including NSWE UK Ltd, NSWE Sports Ltd, Aston Villa Ltd, Aston Villa FC Ltd, Aston Villa Football Club Ltd and NSWE Stadium Ltd, in favour of Kroll Trustee Services as security trustee, with Goldman Sachs International as arranger. The charges assign Premier League central funds, broadcast income, any parachute payments and the group’s other receivables, and cover Villa Park and the academy. It is the same arranger, agent and trustee as Crystal Palace’s £150m facility, at a club playing in the Champions League.
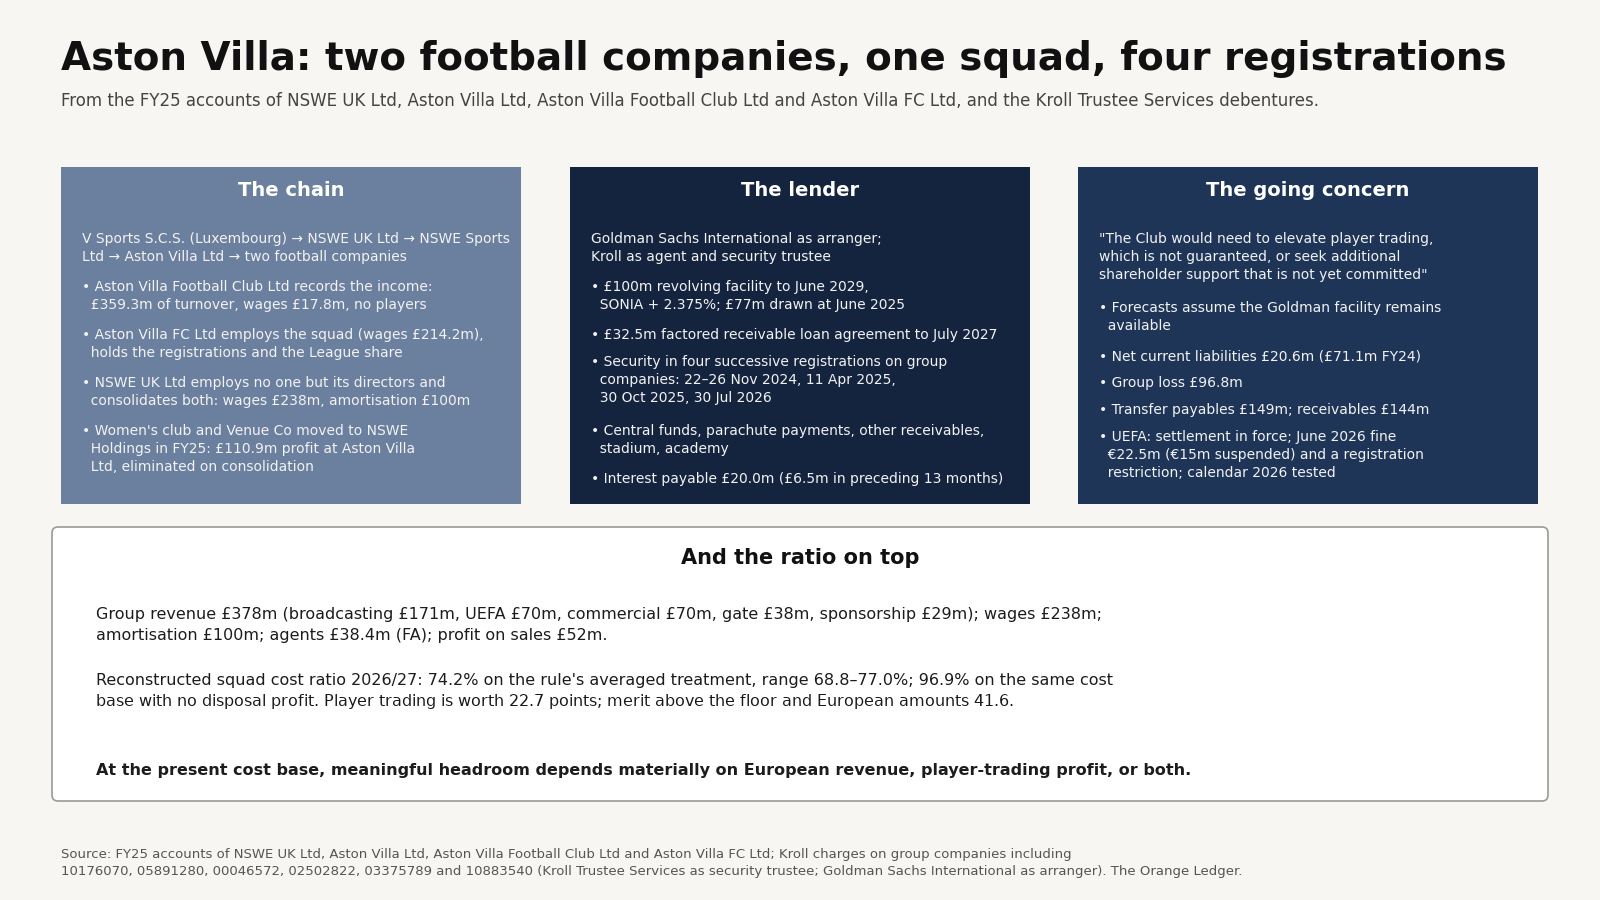
Their lender holds security over money owed to the group, including Premier League central distributions and broadcast income.
What the headroom rests on
For anyone assessing Villa’s position, whether an agent pricing a player, a lender sizing a facility or a sporting director judging what the club can absorb, the two supports behave differently.
- Merit above the floor and European amounts, 41.6 points, reflect a fourth-place finish and a Champions League place. They are renewable, but they have to be earned again each season, and both can fall away together.
- The effect of player-sale profits, 22.7 points, is an average over three years, and 60% of it is the 2026 summer. It leaves the average in time, and a year like it depends on having players the market values far above their book value.
- The cost base does not fall when either support does. The 2026 purchases carry amortisation for several seasons, so the numerator is committed while the denominator is not.
What this doesn’t say
- That Villa’s ratio is exactly 74.2%. The published range is 68.8 to 77.0%, conditional on the current 78 to 83% player-share assumption and the reconstructed Champions League reference amount of £73m within a range of £68m to £82m. The filed headcount cross-check cannot validate the player-share range, because the filed employment category combines players with coaches and football management.
- That the club is in difficulty. Villa have substantial revenue, valuable registrations, committed external facilities and wealthy owners. The position has less margin for a disappointing season than 74.2% suggests, which is a different statement.
- That either support is dispensable. Removing the European revenue or the sale profit narrows the headroom materially, and removing both changes the picture.
- That head-coach costs are fully captured. The head coach is a relevant person under the rule, and no separate head-coach cost has been added, because the wage figure is a share of the filed staff-cost line.
- Where Villa stand on UEFA’s test for 2026. We do not estimate it, and the settlement’s own targets govern what happens next rather than the standard thresholds.
A sale lands its profit in one year and a purchase spreads its cost over several seasons. Villa’s 2026 summer did both at once, which is why the ratio looks comfortable now and why the figure before trading is the one to hold in mind.
Sources and caveats.
The accounts. NSWE UK Ltd consolidated accounts for the year to 30 June 2025, with the thirteen-month comparative to 30 June 2024, filed at Companies House. Aston Villa Ltd, Aston Villa Football Club Ltd and Aston Villa FC Ltd accounts for the same year. Charges registered against group companies including NSWE UK Ltd, NSWE Sports Ltd, Aston Villa Ltd, Aston Villa FC Ltd, Aston Villa Football Club Ltd and NSWE Stadium Ltd in favour of Kroll Trustee Services, with Goldman Sachs International as arranger. The ratio is built from NSWE UK Ltd's consolidated accounts because the company that employs the squad, Aston Villa FC Ltd, and the company that records the income, Aston Villa Football Club Ltd, are both consolidated there. The filed year ends 30 June, so the 2025 and 2026 windows fall wholly or partly outside the last filed accounts and are reconstructed on top of them.
The rules applied. Premier League Handbook 2026/27, Appendix 2, in particular Rules A.1.13, A.1.22, A.1.22(c), A.1.29(a), A.1.29(b), A.1.29(e), A.1.29(g), A.1.29(h) and A.1.53.
What is estimated, and why.
- Player wages, about £219m. NSWE UK's accounts do not separate the wages of the players and the head coach. NSWE UK Ltd files a staff cost of £273.4m and a combined headcount category of 294 players, football management and coaches. This reconstruction uses 78 to 83% of the staff cost, carried forward through the 2025 and 2026 windows. The filed headcount cross-check cannot validate that range, because the filed category combines players with coaches and management, and a separate senior-squad salary build implies a lower share while covering fewer registered players. Neither figure is established.
- European revenue, £73.0m, is the reference amount under Rule A.1.29(e), being the highest of the distribution recognised from that competition in the prior season, the three-year mean in that competition, and the estimated mean distribution for its round of 16. Because Villa played in the Europa League in 2025/26, that campaign does not count toward the Champions League figure, and the round-of-16 reference binds. It is reconstructed from UEFA's published 2025/26 distribution mechanics at £73m within a range of £68m to £82m, the value-based element being the largest source of uncertainty.
- Agents' fees are estimated from the FA's cash figure. Head-coach costs are not separately modelled: the head coach is a relevant person under the rule, and the wage figure is a share of the filed staff-cost line.
Transfers and loans.
- Fees are taken at the reported base where a base and add-ons are separately reported, and otherwise at the reported total. One fee was corrected to its base amount on 20 September 2026, which moved the ratio from 70.3% to 70.4%.
- Sale profits for 2026 and 2027 are calculated from reported fees and the book value of each registration at sale, cost being counted at the reported fee plus 12%, with a 5% deduction for direct costs applied to gains, and less any share of the profit owed to a former club under a sell-on clause: Middlesbrough are owed 20% of Villa's profit on Morgan Rogers, reported at £20.3m.
- Alejandro Garnacho and Aaron Wan-Bissaka are carried as loans, with their wages in squad cost and no registration capitalised.
Completeness. The playing population was checked against the Premier League's submitted senior and Under-21 squad lists from February 2025 to September 2026, and no registration remains unresolved.
Methodology. The Orange Engine sets out the population checks, transaction reconciliation, uncertainty ranges and cross-club controls behind these estimates.
Independent estimate, not an official calculation, and not advice. Figures produced 1 October 2026; updated 3 October, 4 October, 5 October, 9 October, 16 October, 23 October, 25 October, 26 October, 28 October, 31 October and 1 November 2026.
Corrections and updates (18)
21 September 2026 · Data correction · figures not recorded
Correction, 21 September 2026. The ratio is 70.4%, from 70.3% at publication, and 89.4% before player trading, from 89.3%, after one transfer fee was taken to its base amount. The conclusion is unchanged.
25 September 2026 · Data correction · figures not recorded
Correction, 25 September 2026. The ratio is 70.5%, from 70.4%, and 89.4% before player trading is unchanged. Every Villa departure since February 2025 was rebuilt from the clubs’ own announcements, and two sales moved from the year to June 2027 into the year to June 2026. Donyell Malen’s permanent move to Roma completed on 26 May 2026; 29 June was only when Serie A could register him. Enzo Barrenechea’s loan to Benfica carried an option that became an obligation once he reached a set number of appearances, reported as triggered in October 2025, so his sale belongs to that year rather than to his registration in July 2026. Elijah Briscoe, an academy forward who had cost £2.36m in July 2024, was released on 30 June 2026 with book value still on his registration, and that write-off had not been recorded; it is now included. Sale profit for the year to June 2026 rises from £28.1m to £36.8m and for 2027 falls from £264.4m to £253.0m; the three-year average is £113.9m, from £114.8m, and the 2027 year is now 74% of the pool rather than 77%. Two exits recorded as transfers were in fact a contract expiry (Olsen) and a termination (Coutinho), which changes no figure. Headroom is £78.2m, the range 67.7% to 73.4% and the stress case 79.0%.
30 September 2026 · Data correction · figures not recorded
Correction, 30 September 2026. The ratio is unchanged at 70.5% (70.47% to 70.53%), and 89.5% before player trading, from 89.4%. The wage estimate now starts from the exact staff cost in NSWE UK Ltd’s filed accounts, £273.4m including £33.8m of social security, as this article has always stated; the model had been using a rounded £273.0m. Estimated wages rise from £218.8m to £219.1m and the squad cost from £379.2m to £379.5m. Headroom is £77.9m, from £78.2m, the range 67.8% to 73.5%, and the revenue the rule adds 35.8 points, from 35.7. The conclusion is unchanged.
1 and 2 October 2026 · Data correction · SCR 70.5% → 71.9% · before player sales 89.5% → 89.7%
Corrections, 1 and 2 October 2026. The ratio is 71.9%, from 70.5%, and 89.7% before player trading, from 89.5%. Agents’ fees now use the FA’s published £38.4m, the figure this article already cited, and the opening amortisation balance is the £221.4m filed in NSWE UK Ltd’s accounts rather than an estimate. Lucas Digne is carried at the reported £25m he cost rather than nil. Middlesbrough’s 20% share of Villa’s profit on Morgan Rogers, £20.3m, is now deducted, and the costs, contract terms and dates of Watkins, Martínez, Rogers, Bailey, Barrenechea (whose €8m had been recorded as pounds), Coutinho, Dendoncker and Moreno follow the clubs’ announcements and contemporaneous reports. Elijah Briscoe was an academy player, so the write-off added on 25 September is removed. The three-year average of sale profit is now £104.5m; green headroom is £69.0m, the range 69.1% to 74.9% and the stress case 80.7%. Two passages are also corrected. The historical table in “The ratio over time” understated Villa’s past ratios, which were about 93% to 101% in the three periods before 2024/25, and £113.7m of related-party gains, a figure that appears in no filing, is withdrawn. Rebuilt, the UEFA estimate for calendar 2026 is about 71% to 75%, above UEFA’s 70% line. The Premier League conclusion does not change: Villa sit inside the green threshold after player trading and above it before.
3 October 2026 · Data correction · SCR 71.9% → 72.5% · before player sales 89.7% → 90.5%
Correction, 3 October 2026. The ratio is 72.5%, from 71.9%, and 90.5% before player trading, from 89.7%. Counted, from archived match reports. The rule counts the average number of home FA Cup and League Cup matches over the last three seasons, rounded up. Villa played seven (two, four and one), so the rule counts three, where we had assumed two. The rule divides last season’s receipts by last season’s home matches. Villa played 27 (19 league, one cup and seven European), where we had assumed 26. Re-estimated, by our method. Last season’s matchday receipts are not yet filed. We had carried £44.0m; the estimate is now £40.0m: the filed 2024/25 figure of £38.5m, scaled for the change in home matches (cup ties from 4 to 1 and European matches from 6 to 7), with a cup tie counted as 0.15 of a league match and a European match as 0.25, plus 5% for the year. The method, and how far it could be out, is set out in How we estimate matchday revenue. Matchday revenue under the rule is £38.5m, from £42.3m. Also moved: the range is 69.6 to 75.5%, from 69.1 to 74.9%; green headroom is £65.8m, from £69.0m; and the stress case is 81.2%, from 80.7%. A separate review of agents’ fees on signings since the last accounts is under way and may raise this figure; we will report its result.
4 October 2026 · Methodology change · SCR 72.5% → 75.7% · before player sales 90.5% → 94.8%
Correction, 4 October 2026. The ratio is 75.7%, from 72.5%, and 94.8% before player trading, from 90.5%. The squad cost rule defines three things in its own terms, and in each we had used the figure from a club’s accounts (Three definitions in the squad cost rule, and what they change). What a registration costs. The rule counts everything a club pays in connection with a transfer: the fee, the League’s 4% transfer levy and agents’ fees. For players signed since Villa’s last accounts we now count the reported fee plus 12%. Squad cost is £385.4m, from £380.3m, and the three-year average of sale profit is £102.2m, from £104.5m, because a player sold now leaves at a higher book value. This is the result of the review of agents’ fees that our earlier notes promised. Merchandise. The rule counts merchandise at gross profit, sales less the cost of the goods, where we had counted sales in full. Villa’s accounts give no merchandise figure, so we estimate the cost of the goods from the clubs that do: £7.0m, in a range of £2.9m to £15.4m. Cup prize money. The rule counts a three-year average of what a club received from the FA Cup and the EFL Cup. We had entered £7.5m for Villa, a figure with no calculation behind it. Rebuilt from Villa’s cup ties in the last three seasons and the FA’s published prize fund and broadcast fees, it is £0.8m, in a range of £0.7m to £3.2m. The figure is provisional: the EFL publishes no prize money, some broadcast fees are not published, and the top of the range allows for a share of the gate at away ties, which the rule may or may not count. The revenue the rule counts is £406.7m, from £420.4m. Also moved: the range is 72.8 to 79.0%, from 69.6 to 75.5%; green headroom is £47.2m, from £65.8m; the stress case is 84.7%, from 81.2%. The section on UEFA’s test now quotes the two Premier League figures as they stand, a 2026/27 squad cost of £385.4m and a ratio of 75.7%. Its UEFA calculation is unchanged: it uses UEFA’s own basis and has not yet been re-verified under UEFA’s rules; the UEFA range will be recomputed.
5 October 2026 · Methodology change · SCR 75.7% → 76.0% · before player sales 94.8% → 95.0%
Correction, 5 October 2026. The ratio is 76.0%, from 75.7%, and 95.0% before player trading, from 94.8%. We now measure each contract from the day the player was registered to the day it ends. A player who signs in August on a five-year deal has a contract of four years and ten months, because contracts end on 30 June; we had spread his cost over five full years. 35 of Aston Villa’s contract lengths change, 32 of them against an end date we have derived as the 30 June the announced length points to, where no source states the date. The yearly charge for registrations is £126.5m, from £125.4m. The range is 73.0% to 79.3%, from 72.8% to 79.0%. No threshold is crossed. Most clubs move because contract costs are now measured to their actual or derived expiry dates; six also move for club-specific reasons. See the engine changelog.
8 October 2026 · Data correction · no change to the ratio
Correction, 8 October 2026. This article was corrected to identify the correct Aston Villa group entities, to update the companies on which the security was registered, and to correct the description of the £32.5m loan and of the assets the security covers, which do not include the training ground. These corrections do not change the article’s headline figures.
9 October 2026 · Methodology change · SCR 76.0% → 77.4% · before player sales 95.0% → 97.3%
Correction, 9 October 2026. The ratio is 77.4%, from 76.0%, and 97.3% before player trading, from 95.0%. Last season’s commercial revenue is now estimated by one published method, the same for every club. Villa’s 2025/26 accounts are not filed, so the figure is an estimate. We had £112.0m, a judgement of ours. It is now £102.4m: the £90.9m filed for 2024/25 (the two commercial lines of the accounts, £98.7m, less £7.9m of player loan fees printed inside them), grown by 12.7%, the rate the method gives a commercial income of that size (how we estimate last season’s commercial revenue). It is drawn between £73.9m and £138.0m, where we had drawn 7% either way: the new span comes from how far forecasts of this kind have missed in past seasons. The range is 73.2% to 81.3%, from 73.0% to 79.3%. About 1% of our modelled outcomes are above the 85% line, from 0%. The published ratio crosses no threshold. The stress case does: it is now 86.6%, 1.6 points above the 85% line, where it was 84.9%, 0.1 of a point below it. The stress case is the worst case on costs alone, with every uncertain cost input set against the club at once and revenue held at the central estimate; it is not an upper bound of the modelled outcomes. See the engine changelog.
15 October 2026 · Editorial · no change to the ratio
Clarification, 15 October 2026. Wording only; no figure changed. The ranges in this article are assumption ranges, the spread of the model’s inputs between assumed bounds, not calibrated or confidence intervals, and the shares of modelled outcomes above or below a threshold quoted in the notes above are withdrawn.
16 October 2026 · Assumption revision · no change to the ratio
Updated 16 October 2026: loans out now recorded; wage relief shown in ranges. The central figure is unchanged at 77.4%. Aston Villa’s players out on loan are now recorded. Nobody has said how much of their wages the borrowing clubs pay, so the possible saving widens the assumption range rather than moving the central figure: the range is 71.9% to 80.6%, from 73.2% to 81.3%, still wholly below 85%. The stress case, the worst case on costs alone, is 88.0%, from 86.6%. See the engine changelog.
23 October 2026 · Methodology change · SCR 77.4% → 74.4% · before player sales unchanged at 97.3%
Correction, 23 October 2026. This article estimated Aston Villa’s ratio at 77.4%; the corrected figure is 74.4%, and 97.3% before player trading is unchanged. We had missed £61.8m of profit on player sales. The rule averages the profit or loss on sales in the six most recent transfer windows (Rules A.1.13 and A.1.53), and for the March 2027 test that period starts on 2 February 2024. We had averaged three financial years starting on 1 July 2024, so Villa’s sales between February and June 2024 were left out: Douglas Luiz to Juventus, Omari Kellyman to Chelsea and Tim Iroegbunam to Everton, all completed before 30 June 2024, less a small loss on Morgan Sanson’s move to Nice. Nothing in Villa’s own figures changed; the error was in how we read the rule.
- Moved: the three-year average of sale profit is £122.7m, from £102.1m, worth 23.0 percentage points, from 19.9. Green headroom is £55.3m, from £37.8m. The range is 69.1% to 77.3%, from 71.9% to 80.6%. The stress case is 84.5%, from 88.0%, and now below the line. The 2026 summer is 60% of the pool, from 72%.
- One comparison turns round: Villa’s 74.4% is now below the twenty clubs’ 74.9% (from 75.6%), where 77.4% was above it.
- Unchanged: the UEFA bridge, which is on UEFA’s own calendar-year basis. The lead chart, the cover and the structure chart are redrawn with these figures. See the engine changelog.
23 October 2026 (second) · Methodology change · SCR 74.4% → 74.2% · before player sales 97.3% → 96.9%
Correction, 23 October 2026 (second of the day). This article estimated Aston Villa’s ratio at 74.4%; the corrected figure is 74.2%, and 96.9% before player trading, from 97.3%. We had not done two things the rules require at Villa.
- The five-year cap, on contracts already on the books. Rule A.1.22(c) caps the spreading of a transfer fee at five years for any contract executed since 12 December 2023. We applied it to signings since the last accounts but charged registrations already in the filed book value over their full contract. Four Villa contracts fall under it, Ian Maatsen’s six-year contract the largest; together they add £1.6m, and amortisation is £128.2m.
- The UEFA Super Cup. Rule A.1.29(h) counts revenue from the Super Cup in the season the match is played. Villa played Paris Saint-Germain on 12 August 2026 and lost 2-1; UEFA’s circular for the 2026/27 competitions pays each club €4m and the winner €1m more. At the European Central Bank’s rate for that day, Villa’s €4m is £3.4m, and the revenue the rule counts is £400.5m.
- Moved: green headroom is £56.5m, from £55.3m. The range is 69.0% to 77.1%, from 69.1% to 77.3%; the stress case is 84.3%, from 84.5%. Player trading is worth 22.7 points, from 23.0, and the revenue the rule adds 41.6, from 42.3, because the revenue they are measured against is larger.
- Unchanged: the conclusion, and the UEFA bridge, which is on UEFA’s own calendar-year basis. The lead chart, the cover and the structure chart are redrawn. See the engine changelog.
25 October 2026 · Data correction · no change to the ratio
Correction, 25 October 2026. The ratio, 74.2%, is unchanged. Four statements are corrected. The article said Villa are not net debtors to the transfer market, beside its own figures of £148.9m owed to other clubs and £143.7m owed to Villa: they are net debtors by £5.2m. The sentence is removed and the figure given where the two balances are. The UEFA sanctions were out of order: the settlement of July 2025 followed the 2024 breach, with a fine of €11m; the €22.5m of June 2026 is for 2025, with €15m conditional on the ratio continuing to fall, and the restriction on registering new players applies to the 2026/27 UEFA season, not to calendar 2025 (UEFA, finalisation of club monitoring for 2025/26). The UEFA estimate, which has not been recomputed, gave the 2026/27 squad cost as £388.2m, the current figure, beside a range built on the figure of the day, about £380m; it now gives the figure it used, and its date, 2 October. And the history table’s amortisation column includes £6.5m of impairment, which the League’s rule counts in squad cost (guidance to Rule A.1.22); the heading now says so.
26 October 2026 · Regulatory interpretation · no change to the ratio
Correction, 26 October 2026. The ratio is unchanged at 74.2%. Villa’s loan income is now in the range. Fees a club receives for lending players count with the profit on player sales (the guidance to Rule A.1.29(g)). The filed accounts give a total for loan income without saying how much is fee and how much is wages recharged, so the central figure counts none of it and the range allows anything from none to all of it; only income from 2 February 2024 counts (Rule A.1.53), and 2025/26’s waits for the accounts. Villa filed £7.9m for 2024/25 and £3.5m for the thirteen months to June 2024. The range is 68.8% to 77.0%, from 69.0% to 77.1%. Elsewhere in the article, the twenty clubs together come to 75.0%, from 74.9%. Fees paid and received for head coaches now count, at Manchester City, Chelsea, Brentford, Ipswich, Newcastle and Crystal Palace (Rules A.1.22(d) and A.1.29(g)).
28 October 2026 · Data correction · no change to the ratio
Correction, 28 October 2026. Aston Villa’s ratio is unchanged at 74.2%. Elsewhere in the article, the twenty clubs together come to 75.1%, from 75.0%. We checked every transfer in our records against published sources and corrected sixteen entries at eleven clubs where the club’s announcement or a reputable report, read on the page, gives a different fee, contract length or date. The corrections move Arsenal, Chelsea, Sunderland, Crystal Palace and Tottenham up, and Coventry, Nottingham Forest and Bournemouth down.
31 October 2026 · Data correction · no change to the ratio
Correction, 31 October 2026. The twenty clubs together come to 75.3%, from 75.1%, because Chelsea’s and Liverpool’s filed sale profit replaces our modelled figures and 19 transfer entries are corrected across the league. Aston Villa’s own ratio, 74.2%, is unchanged. Figures that follow from these are restated with them in the text. The correction does not reverse the article’s conclusion.
1 November 2026 · Editorial · no change to the ratio
Correction, 1 November 2026. Villa’s ratio is unchanged at 74.2%. Our estimate for UEFA’s calendar 2026 test, 71% to 75%, is withdrawn. It rested on figures from 2 October, as the article said, and we have not been able to recompute it under UEFA’s method. The article also said a recomputation would follow; none will until the accounts to June 2026 are filed. The record of sanctions now separates the settlement of July 2025, €5m under the football earnings rule and €6m for the squad cost limit in 2024, from the fine of June 2026 for 2025, and it says the List A restriction lifts with a positive transfer balance. The label “revenue added by the rule” and the wording of revenue the rule supplies are replaced, because Villa earned their merit by finishing fourth. Middlesbrough’s 20% is now said to be measured against a £15.5m purchase price. The loan wages are marked as a full-season figure. The sentence that no club discloses its players’ wage bill now speaks only of NSWE UK, and the player-share range is no longer described as under review. The sources now list Rule A.1.29(g). Two repeating sections, on the squad lists and on what the article says, are removed; the squad-list check stays in the sources.