
Analysis
The window that bought itself
Premier League clubs spent a record £3.46bn this summer, and forty per cent of it went to other Premier League clubs. Six summers of transfer data on where the money goes, whether English clubs pay each other a premium, and what a market that increasingly trades with itself on deferred terms looks like from the outside.
SCR 2026/27·Post-summer projection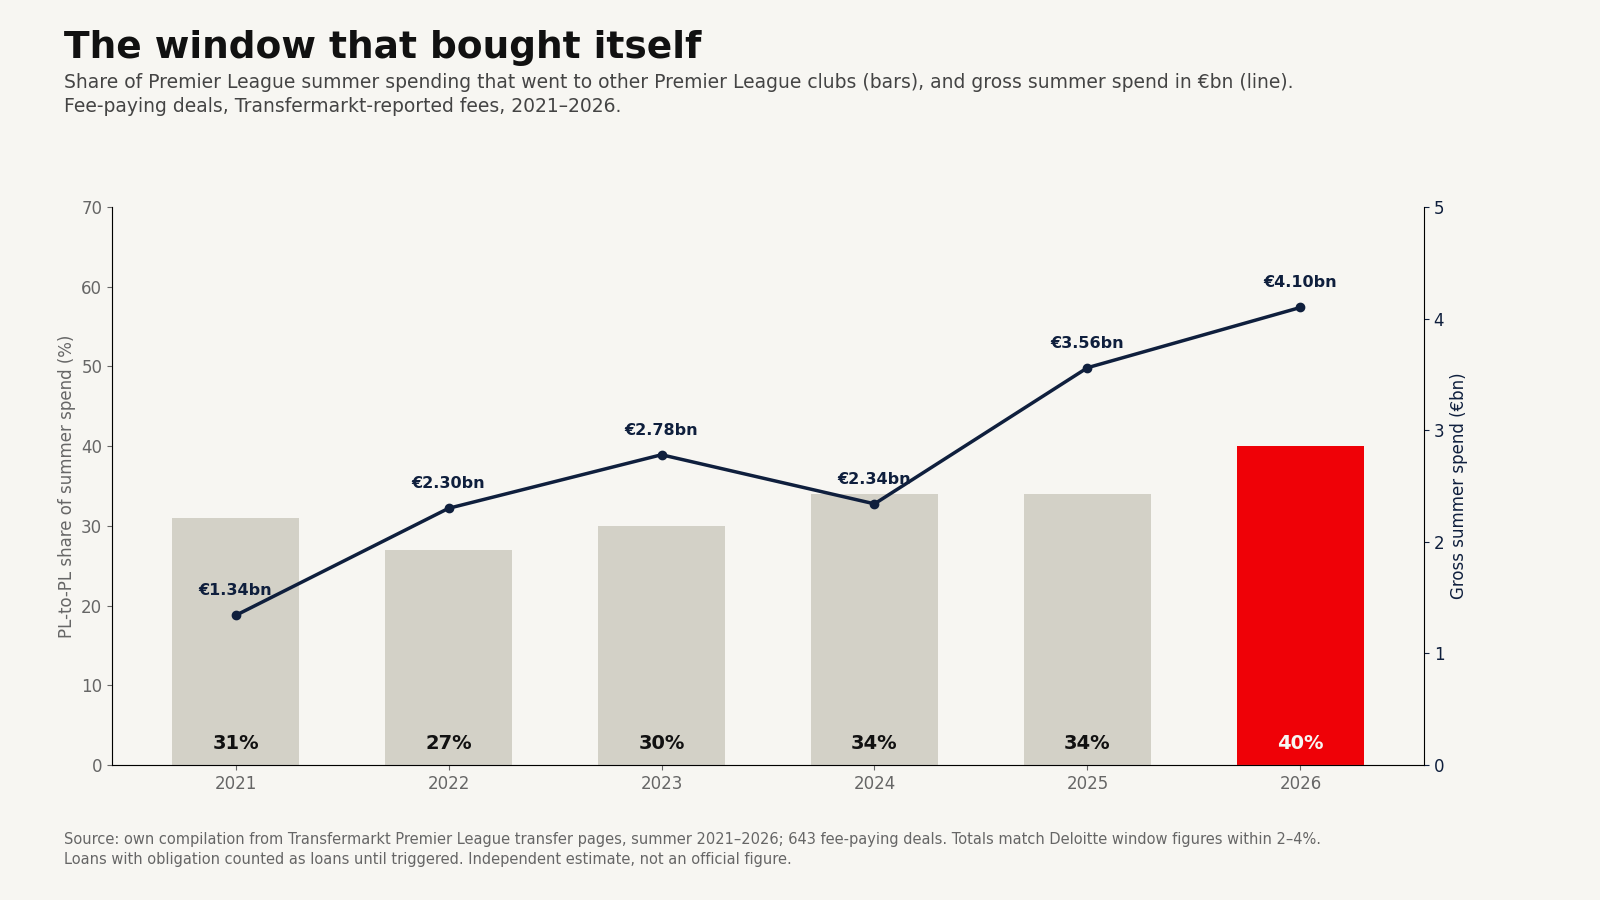
Latest note, 25 October 2026 (second): data correction, no figure changed. All 4 correction notes are at the end.
Every September the same paragraph gets written: record spending, this time £3.46bn, more than the other four big leagues combined. What is rarely written is where the money went. The question here is which clubs were paid. This summer 40% of the money went to other Premier League clubs, up from 27% in 2022, and if a growing share of a record window is Premier League clubs paying each other, the headline measures something different from what it seems to.
I built the dataset to find out. Every incoming transfer for every Premier League club, from Transfermarkt’s league pages, for the six summer windows from 2021 to 2026: 1,693 registrations, 643 of them with a fee. For each deal I recorded the selling club, its country, the fee, and Transfermarkt’s market value for the player at the time. On my comparison, the totals come within a few per cent of the sterling figures published for each window, which is close enough to trust the shape.
Where the money goes
Transfermarkt records fees in euros, so the table below is in euros. Its total for 2026, €4.10bn, is within a few per cent of the £3.46bn headline once converted; the two are separate counts of the same window, not one figure in two currencies.
The share of summer spending that went to other Premier League clubs:
| Summer | Gross spend €m | To other PL clubs €m | Share | €50m+ deals | of which domestic |
|---|---|---|---|---|---|
| 2021 | 1,336 | 419 | 31% | 4 | 2 |
| 2022 | 2,298 | 614 | 27% | 12 | 5 |
| 2023 | 2,777 | 830 | 30% | 16 | 6 |
| 2024 | 2,341 | 804 | 34% | 6 | 3 |
| 2025 | 3,560 | 1,191 | 33% | 19 | 9 |
| 2026 | 4,101 | 1,638 | 40% | 26 | 16 |
Gross spending more than tripled from 2021 to 2026, and rose by almost 80% from 2022. Within it, spending on players bought from other Premier League clubs rose from €614m in 2022 to €1.64bn in 2026, an increase of more than €1bn, which accounts for a large part of the growth in gross activity.
Spending on players from outside the Premier League rose by almost half over the same period, from €1.68bn to €2.46bn. So the domestic share climbed from 27% to 40%, and it climbed fastest at the top: sixteen of this summer’s twenty-six deals above €50m were between Premier League clubs, against five of twelve four years ago.
Count every English seller, relegated and Championship clubs included, and half the money this summer stayed in England.
That matters for reading the headline. A £100m deal between two Premier League clubs is £100m of “spending” and £100m of “sales” in the same league in the same window. The buyer records a £100m player registration and, for any part of the fee not yet paid, a debt to the seller. The seller removes the player from its books, books a profit or loss against what was left of his cost, and, for any part not yet received, records a sum owed to it. Nothing comes into the league from outside.
Do they pay each other more?
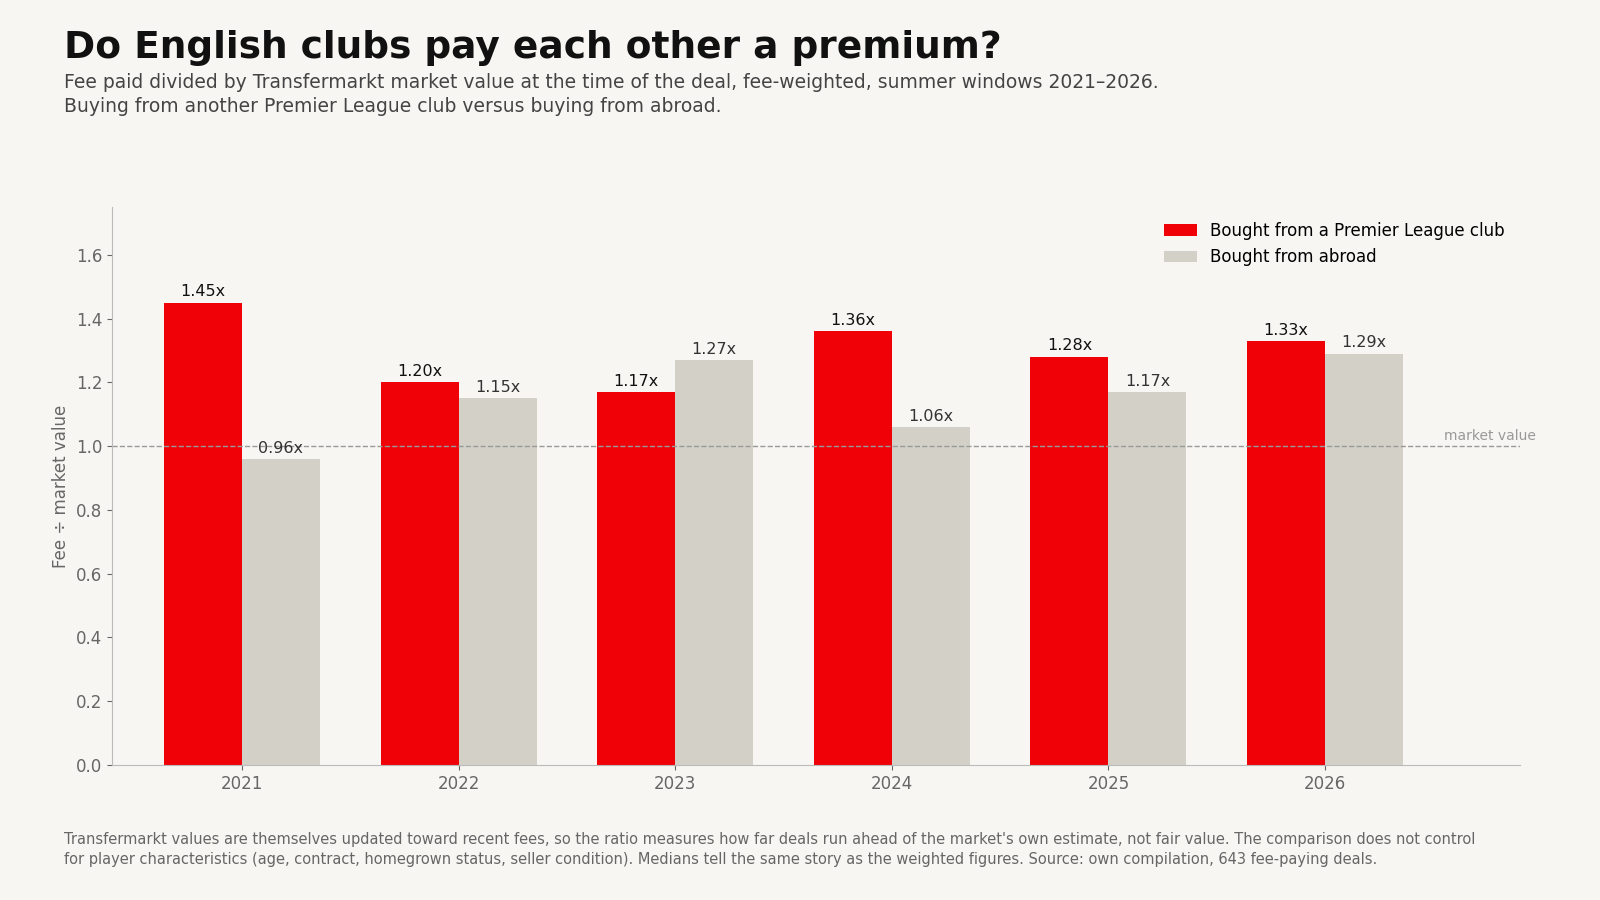
If the market is increasingly internal, the next question is whether it sets its own prices. The test is the fee paid divided by the market value Transfermarkt assigned the player at the time, split by where he came from.
| Summer | From PL clubs | From abroad |
|---|---|---|
| 2021 | 1.45x | 0.96x |
| 2022 | 1.20x | 1.15x |
| 2023 | 1.17x | 1.27x |
| 2024 | 1.36x | 1.06x |
| 2025 | 1.28x | 1.17x |
| 2026 | 1.33x | 1.29x |
The data is consistent with a recurring domestic premium, but not with one that is widening. English clubs paid more over market value when buying from each other than from abroad in five of six summers, by between 0.04x and 0.49x of market value; 2023 reverses it, and by 2026 the gap had narrowed to 0.04x, with both ratios at about 1.3x. Both groups were paying above Transfermarkt valuations, but these comparisons cannot establish whether domestic transfers were becoming more expensive for otherwise comparable players, or whether prices across the market were rising.
This is descriptive evidence, not a clean test. Nothing here controls for the things that differ systematically between a domestic purchase and an import: the player’s age and remaining contract, whether he’s homegrown, whether he’s already proven in this league, whether the seller is a rich club or a pressured one. Any of those could produce a premium without any pricing effect at all. And Transfermarkt’s values are themselves updated toward recent fees, increasingly Premier League-to-Premier League ones, so a stable ratio could be hiding a premium the valuations have absorbed. On this evidence, a domestic premium is plausible and recurring, that it isn’t growing, and that the price data alone doesn’t establish an internal pricing mechanism.
What the network is made of
What the data supports is a volume and credit story rather than a price story, and it has five steps.
- Volume. Gross transfer activity has grown much faster than the business underneath it. The twenty clubs’ combined turnover rose by a quarter, from £5,460.0m in 2021/22 to £6,830.1m in 2024/25, the latest filed season, on the Orange Ledger’s own accounts data; summer transfer commitments roughly tripled, from €1,336m in 2021 to €4,101m in 2026.
- Internal concentration. A rising share of that activity, 40% of the money and 60% of the largest deals this summer, takes place between the same twenty clubs.
- Deferred settlement. Clubs buy on instalments. A club agreeing a £100m transfer over four annual instalments recognises a player registration asset of roughly £100m while paying perhaps £25m of cash up front; the cost reaches its income statement through amortisation over the contract, not as a £100m expense. The seller recognises its profit on the sale in its accounts immediately, whatever the cash timing, while the cash may arrive over several years. Under the squad cost rule, the seller’s profit is also spread across three seasons through a three-year average. So one transaction runs on three clocks: the seller’s accounting for the sale, the buyer’s amortisation, and the cash settlement that both live with, on a timetable of its own.
- Bilateral exposure. Deferred settlement leaves obligations behind. On Paul Quinn’s aggregation of the audited accounts, Premier League clubs’ gross transfer payables stood at £3.50bn at 30 June 2025, up from about £3.1bn a year earlier, against £1.25bn of receivables. His modelled figures, and they are models rather than balance-sheet numbers, put payables at around £4.7bn before this window and £5.5bn by June 2027, with net transfer debt of about £3.3bn. Quinn’s point is that a club owed £200m while owing £250m is not in the same position as a club that simply owes £50m, because if its debtors fail the netting doesn’t happen. Exposure is gross.
- Counterparty dependency. Because 40% of this summer’s spending went to other Premier League clubs, there is greater potential for deferred obligations between clubs in the same division. How much of that spending remains unpaid, and who ultimately owes whom, cannot be established from the public transfer data, and the stock of payables built up over earlier windows also includes debts to clubs abroad. What the data does show is that more of the market’s activity now runs between clubs whose ability to pay may depend in part on the others continuing to buy, sell and pay on schedule.
Put together: a market whose recorded activity is growing far faster than its revenue, where an increasing share of that activity takes place among the same twenty balance sheets, and where that internal activity can leave obligations between the participants. Premier League clubs remain large net exporters of transfer money to the rest of Europe, and about half of this summer’s spending went abroad. The market is turning inward, with growing scope for credit between its own clubs.
Why it matters, and to whom
For a selling club, another Premier League club now represents an unusually large share of potential demand: around 40% of the division’s 2026 spending went to other Premier League clubs, and those buyers are on the same rulebook, the same deferred-payment habits and the same allowance under the squad cost rule. For anyone owed instalments by a Premier League buyer, that buyer is more likely than before to be trading with, and perhaps owing, other clubs in the same league.
The data does not prove a Premier League transfer bubble. It shows a transfer market turning inward, with credit connections between its clubs that are growing in potential faster than anyone outside the clubs can map.
The question is how dependent each club has become on the other participants continuing to buy, sell, lend and settle on schedule. The next test is what happens when the credit financing that network becomes more expensive or less available.
Method and caveats.
The dataset. Transfermarkt Premier League transfer pages, summer windows 2021 to 2026: arrivals for all twenty clubs each season, fee-paying deals only (643 of 1,693 registrations). Fees are as reported, in euros, with add-ons excluded. Loans with an obligation to buy are counted as loans until the obligation is triggered, which understates spending between Premier League clubs in summer 2025. "To other PL clubs" means the selling club was in the Premier League that season; counting all English sellers raises the English share to between 36% and 50%. The £3.46bn headline is the total reported by Reuters on 2 September 2026; the comparison with each window's sterling total is our own.
Valuations and balances. Market values are Transfermarkt estimates at the time of each deal, are themselves influenced by recent fees, and the fee-to-value comparison does not control for player characteristics. Payables and receivables at 30 June 2025 and 2024 are Paul Quinn's aggregation of filed accounts (theesk.org, 3 September 2026); the 2026 and 2027 figures are his models. Revenue growth is from Deloitte's Annual Review of Football Finance.
Independent estimate, not an official calculation.
Corrections and updates (4)
22 October 2026 · Data correction · several figures: see the note
Correction, 22 October 2026. Several statements did not match the article’s own table or its sources, and some conclusions went further than the data allows. Figures stated in the text change as set out below; no figure in the dataset or the tables changed.
- Growth in gross spending. The article said gross spending “tripled from 2022 to 2026”. On its own table it rose from €2,298m to €4,101m, about 80%. It more than tripled from 2021 (€1,336m).
- Spending from outside the Premier League. The article said spending on imports “roughly doubled” over the same period. Spending on players from clubs outside the Premier League rose from €1,684m to €2,463m, by almost half. That figure includes English clubs outside the Premier League.
- Spending abroad. The article said 60% of this summer’s spending went abroad. The 60% not spent with Premier League clubs includes English clubs outside it; counting all English sellers, about half went abroad, as the article itself said elsewhere.
- Earlier payables. The article attributed gross payables of £2.98bn and £3.18bn at the two year-ends before June 2025 to Paul Quinn. His analysis gives about £3.1bn at June 2024 and no comparable figure for June 2023, and the article now uses his figure.
- Who owes whom. The article said that because 40% of the volume is internal, “most of those payables” are owed between Premier League clubs. This summer’s spending measures new deals, not the stock of debts built up over earlier years, which includes debts to clubs abroad. Nor does the share of spending show how much of it is deferred or still unpaid. The article now says there is greater potential for obligations within the league, and that who owes whom cannot be established from public data. For the same reason, “an increasingly self-referential credit network” and “becoming a credit network” now describe a market turning inward, with growing scope for credit between its clubs.
- Market-wide inflation. The article said the 2026 ratios looked “more like market-wide inflation lifting every price”. The ratios compare fees with Transfermarkt valuations and cannot show whether prices for comparable players were rising; the article now says only that the gap narrowed to 0.04x.
- The domestic premium. The article said English clubs paid “typically ten to thirty points more” when buying from each other. On its table the gap ranges from 0.04x to 0.49x of market value in the five summers where it was positive.
- A £100m deal. The article said such a deal “creates an asset on one balance sheet and a liability on another”. The buyer records both the registration and any unpaid fee; the seller removes the player, books a profit or loss, and records any sum still owed to it.
- The headline and the comparison. The £3.46bn is now attributed to Reuters, and the comparison with each window’s sterling total is described as our own and as “within a few per cent”, where the article had said two to four per cent.
The article’s findings stand: the domestic share of spending rose from 27% to 40%, the domestic premium is recurring but not widening, and more of the market’s activity, and so its potential obligations, now runs between its own clubs. The errors were ours, in reading the table and the sources.
22 October 2026 (second) · Editorial · no figure changed
Editorial, 22 October 2026. Wording only; no figure changed.
- The five steps are numbered.
- A line above the first table explains that it is in euros and how it relates to the sterling headline.
- The repeated summary in “Why it matters, and to whom” is cut.
- Fragments, a colon reveal and “not X but Y” constructions are rewritten.
- The three-year averaging under the squad cost rule is explained.
- The standfirst says six summers rather than five years.
- Numeric table columns are right-aligned.
- The method note is divided into headed paragraphs, and its ranges are written with “to”.
25 October 2026 · Data correction · no figure changed
Correction, 25 October 2026. No figure changed. The sources said counting loans with an obligation to buy as loans understates domestic spending in 2025/26, against a table set out by summer. The row it affects is summer 2025, the window of the loans whose obligations had not been triggered, and the spending it understates is between Premier League clubs; the sentence now names both.
25 October 2026 (second) · Data correction · no figure changed
Correction, 25 October 2026 (second). The sentence comparing revenue with transfer spending said league revenue rose by roughly a quarter over broadly the same period, without a source or the seasons. It now gives both, from the Orange Ledger’s own accounts data for the twenty clubs: £5,460.0m in 2021/22 and £6,830.1m in 2024/25, the latest filed season, a rise of 25%. The tripling of transfer commitments is the table’s, 2021 to 2026.