
Analysis
Every club, rebuilt on the rule's own definitions
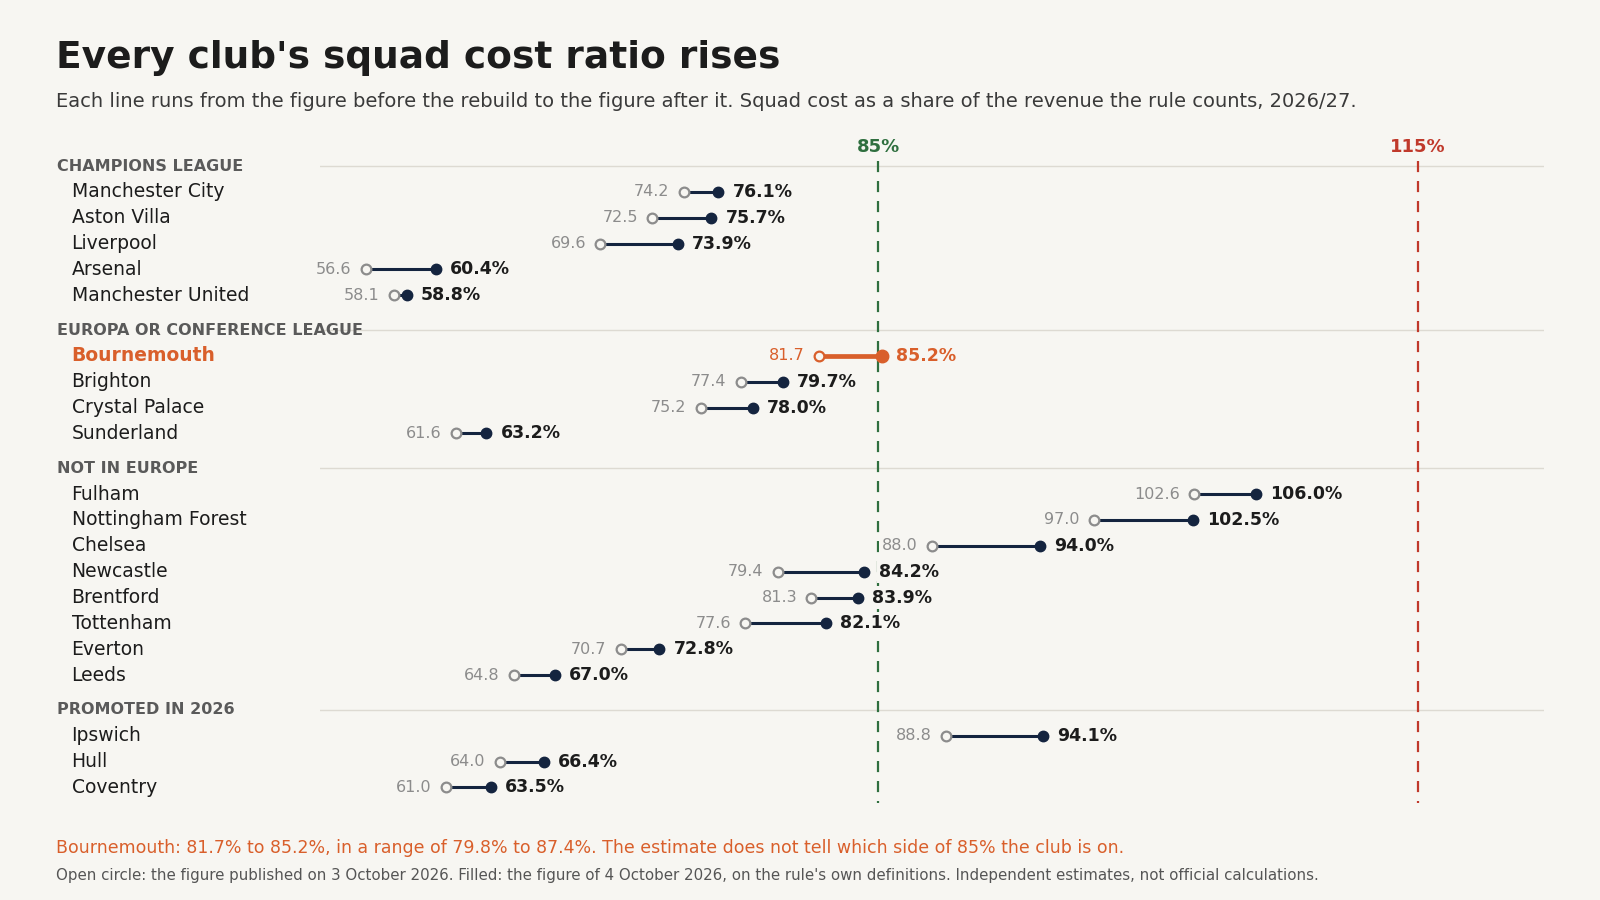
We have rebuilt all 20 squad cost ratios on the definitions in the Premier League's rule itself. Every ratio rises, Bournemouth now sit on the 85% line, and three clubs' squads cost more than 115% of what the rule counts before player trading.
Figures as of 4 October 2026, Orange Engine release V2BN · Latest figures · What the engine does not capture
Latest note, 24 October 2026: methodology change; no figure changed. All 4 correction notes, unchanged, are at the end.
Today we have rebuilt the squad cost ratio of every Premier League club. Not because anything happened on the pitch, but because we went back to the rule’s own definitions, line by line, and found four places where our figures had not followed them.
Every ratio rises. For most clubs the rise is between two and six percentage points. Bournemouth now sit on the 85% line, and three clubs’ squads already cost more than 115% of the revenue the rule counts before player trading: Nottingham Forest, Fulham and Chelsea. Under the rule, Bournemouth is the only club whose position changes: its central figure moves onto the 85% line. Before player trading, Fulham and Chelsea crossed 115%.
This article explains what changed and why. The detailed method is in “Three definitions in the squad cost rule, and what they change”, and every club article carries a dated note with its own figures.
A reminder of how the ratio works
The squad cost ratio divides what a club spends on its squad by the revenue the rule allows it to count:
- Squad cost is player wages, the annual write-off (amortisation) of what the club paid to sign its players, and agents’ fees.
- The revenue the rule counts is the club’s revenue as the rule defines it, plus the average profit from selling players in the last six transfer windows, about three years.
Above 85% a club pays a levy from 2027/28, charged on the overspend; above its red line, which starts at 115% and moves down after a season over 85%, it loses league points. A correction can therefore move a ratio in two ways: by raising the cost on top, or by lowering the revenue underneath. Our four corrections do both, and all of them push the ratio up.
The four corrections
1. What a signing really costs. The rule counts everything payable in connection with a transfer, “whether to a Transferor Club or otherwise”. That includes agents’ fees and the League’s own 4% levy on every transfer fee (Rule V.38, which also applies to transfers from abroad). We had been writing off recent signings at the reported fee alone. Where clubs’ accounts let us measure it, the cost they actually capitalise runs about 11% to 17% above the reported fee. We now use the fee plus 12%: four percentage points of that are the levy, which is a rule; the rest is an estimate, and we carry it as a range from 6% to 20%.
2. What counts as gate receipts. The rule defines gate receipts as memberships, general admission and corporate match attendance. One club’s figure had included shop merchandise and other income as well. We now use the rule’s definition for every club.
3. Merchandise at profit, not sales. The rule counts merchandise in commercial revenue at its gross profit, not its sales. Every club’s figure had counted the full sales. Where a club files the cost of its goods we use it; where it does not, we estimate it from the clubs that do, and say so. That now holds for every club except Leeds, whose sales are still counted in full until the footing of its estimate is recorded.
4. Cup income. The rule counts the average of a club’s cup distributions over three seasons. Every club’s figure was too high, by between 1.3 and 16 times. We have rebuilt it from the FA’s published prize fund and broadcast fees, match by match, across 337 cup ties. 324 of them rest on an archived match report.
These were our errors. Each correction is shown, club by club, in the dated notes.
Where the clubs now stand
The ratio under the rule, then the same squad cost before any player-sale profit is counted. Clubs are grouped by their competition this season.
| Club | Ratio under the rule | Before player trading |
|---|---|---|
| Champions League | ||
| Manchester City | 76.1% | 88.1% |
| Aston Villa | 75.7% | 94.8% |
| Liverpool | 73.9% | 81.4% |
| Arsenal | 60.4% | 64.7% |
| Manchester United | 58.8% | 61.9% |
| Europa or Conference League | ||
| Bournemouth | 85.2% | 104.7% |
| Brighton | 79.7% | 110.8% |
| Crystal Palace | 78.0% | 100.5% |
| Sunderland | 63.2% | 70.6% |
| Not in Europe | ||
| Fulham | 106.0% | 117.0% |
| Nottingham Forest | 102.5% | 129.1% |
| Chelsea | 94.0% | 116.4% |
| Newcastle | 84.2% | 107.4% |
| Brentford | 83.9% | 106.2% |
| Tottenham | 82.1% | 91.7% |
| Everton | 72.8% | 83.6% |
| Leeds | 67.0% | 70.8% |
| Promoted in 2026 | ||
| Ipswich | 94.1% | 104.5% |
| Hull | 66.4% | 73.6% |
| Coventry | 63.5% | 65.7% |
Bournemouth: on the line
Bournemouth’s central figure is 85.2%, just above the 85% line, but its assumption range runs from 79.8% to 87.4% and spans the 85% line. Our estimate cannot tell which side of the line the club is on. Three inputs drive that uncertainty: the share of the wage bill that goes to the squad, last season’s commercial revenue, and the reference amount the rule uses for European prize money. The squad costs about £0.6m more than 85% of the revenue the rule counts, which is close to nothing in a squad of Bournemouth’s size.
Three clubs above the red line before trading
Before any profit from selling players is counted, three clubs’ squads cost more than 115% of the revenue the rule counts: Nottingham Forest at 129.1%, Fulham at 117.0% and Chelsea at 116.4%. Fulham and Chelsea crossed that line in this release; Forest were already above it.
That is not the figure the rule tests. With the three-year average of player-sale profit included, Fulham are at 106.0%, Forest at 102.5% and Chelsea at 94.0%: all three above 85%, none above 115%.
The clubs close behind
Three clubs not in Europe now sit within about three percentage points of 85%: Newcastle at 84.2%, Brentford at 83.9% and Tottenham at 82.1%. The assumption range of each of the three spans the line. None of the three is above the line at the central figure.
How much to trust these figures
Every figure is an estimate built from filed accounts, published rules and archived sources, and every one carries an assumption range, not a confidence interval. Those ranges are now wider than before, because they include the uncertainty in the new estimates: the 12% on signings, the profit margin on merchandise, and the matchday and cup figures. The largest single source of uncertainty at every club is still the share of the wage bill that goes to the squad.
One known limit remains. The rule counts conferences, concerts and other non-match events at their profit, not their revenue, and no club publishes that profit, so we still count them in full. If anything, that makes every ratio here slightly low.
These are independent estimates, not official calculations. Not advice.
Corrections and updates (4)
9 October 2026 · Editorial · several figures: see the note
Note, 9 October 2026. This article is the record of 4 October 2026 and is not current. Our figures have changed in several releases since, and some statements below are no longer true of today’s figures: among them, which clubs’ squads cost more than 115% of what the rule counts before player trading, and the order of the clubs nearest the 85% line. Each club’s own article carries its current figures, and every change is listed in the engine changelog. The note of 5 October below describes only the first of those later releases.
15 October 2026 · Editorial · several figures: see the note
Clarification, 15 October 2026. Wording only; no figure changed. The ranges in this article are assumption ranges, the spread of the model’s inputs between assumed bounds, not calibrated or confidence intervals, and the shares of modelled outcomes above the 85% line that the text gave are withdrawn.
5 October 2026 · Editorial · several figures: see the note
Note, 5 October 2026. This article is the record of the rebuild of 4 October 2026, and its figures and tables are left as published that day. A later correction has changed the current figures: every club’s ratio is 0.1 to 0.9 points higher, and no club’s position against 85% or 115% has changed. Each club’s own article carries its current figures, and every change is listed in the engine changelog.
24 October 2026 · Methodology change · no figure changed
Correction, 24 October 2026. No figure changed. This article said the rule averages profit on player sales over the last three years. It takes the profit or loss on sales in the six most recent transfer windows and divides it by three (Rules A.1.13 and A.1.53). Six windows cover about three years, but a club’s sales from February to the end of its financial year fall in a later window than the rest of that year, so they stay in the average for one test longer. The sentence now says six transfer windows. The article’s figures are those of its release and are not restated here; the latest are on Premier League SCR 2026/27.